| Param | Original file | Final file |
|---|---|---|
| Filename | modeM0/AS1A02_071T01_9000001078cztM0_level2.evt | modeM0/AS1A02_071T01_9000001078cztM0_level2_quad_clean.evt |
| Size (bytes) | 10,309,158,720 | 1,868,281,920 |
| Size | 9.6 GB | 1.7 GB |
| Events in quadrant A | 73,655,187 | 11,791,166 |
| Events in quadrant B | 70,683,912 | 12,137,903 |
| Events in quadrant C | 80,085,762 | 11,818,362 |
| Events in quadrant D | 78,291,097 | 11,187,403 |
| Mode M9 | |||
|---|---|---|---|
| Quadrant | BADHDUFLAG | Total packets | Discarded packets |
| A | 0 | 214 | 0 |
| B | 0 | 214 | 0 |
| C | 0 | 214 | 0 |
| D | 0 | 214 | 0 |
| Mode M0 | |||
|---|---|---|---|
| Quadrant | BADHDUFLAG | Total packets | Discarded packets |
| A | 0 | 314775 | 0 |
| B | 0 | 304090 | 0 |
| C | 0 | 334905 | 0 |
| D | 0 | 330890 | 0 |
| Mode SS | |||
|---|---|---|---|
| Quadrant | BADHDUFLAG | Total packets | Discarded packets |
| A | 0 | 2868 | 0 |
| B | 0 | 2868 | 0 |
| C | 0 | 2868 | 0 |
| D | 0 | 2868 | 0 |
| Quadrant | Total seconds | Saturated seconds | Saturation percentage |
|---|---|---|---|
| A | 140892 | 4071 | 2.889447% |
| B | 140891 | 3142 | 2.230093% |
| C | 140892 | 3203 | 2.273373% |
| D | 140892 | 4290 | 3.044885% |
Noise dominated data is calculated using 1-second bins in cleaned event files. If a bin has >2000 counts, and if more than 50% of those come from <1% of pixels, then it is considered to be noise-dominated and hence unusable.
| Quadrant | # 1 sec bins | Bins with >0 counts | Bins with >2000 counts | High rate bins dominated by noise | Noise dominated (total time) | Noise dominated (detector-on time) | Marked lightcurve |
|---|---|---|---|---|---|---|---|
| A | 162537 | 140919 | 1455 | 1455 | 0.90% | 1.03% |  |
| B | 162537 | 140920 | 576 | 576 | 0.35% | 0.41% |  |
| C | 162537 | 140920 | 1244 | 1244 | 0.77% | 0.88% |  |
| D | 162537 | 140920 | 2518 | 2518 | 1.55% | 1.79% |  |
Top three noisy pixels from each quadrant. If the there are fewer than three noisy pixels in the level2.evt file, extra rows are filled as -1
| Pixel properties | Quadrant properties | ||||||
|---|---|---|---|---|---|---|---|
| Quadrant | DetID | PixID | Counts | Sigma | Mean | Median | Sigma |
| A | 15 | 239 | 7357845 | 2219.67 | 16548 | 16196 | 3307.5 |
| A | 2 | 79 | 1453295 | 434.49 | 16548 | 16196 | 3307.5 |
| A | 15 | 223 | 293061 | 83.71 | 16548 | 16196 | 3307.5 |
| B | 4 | 239 | 3435040 | 1084.3 | 16797 | 16372 | 3152.9 |
| B | 4 | 81 | 402673 | 122.52 | 16797 | 16372 | 3152.9 |
| B | 11 | 51 | 328437 | 98.98 | 16797 | 16372 | 3152.9 |
| C | 1 | 16 | 14061158 | 3749.29 | 16310 | 16390 | 3746.0 |
| C | 9 | 68 | 2129905 | 564.21 | 16310 | 16390 | 3746.0 |
| C | 8 | 229 | 216859 | 53.52 | 16310 | 16390 | 3746.0 |
| D | 1 | 52 | 7579039 | 1912.36 | 16222 | 15731 | 3955.0 |
| D | 14 | 34 | 1575254 | 394.32 | 16222 | 15731 | 3955.0 |
| D | 13 | 112 | 1453135 | 363.44 | 16222 | 15731 | 3955.0 |
Histogram calculated using DETX and DETY for each event in the final _common_clean file
| Quadrant A |  |
 |
Quadrant B |
|---|---|---|---|
| Quadrant D | 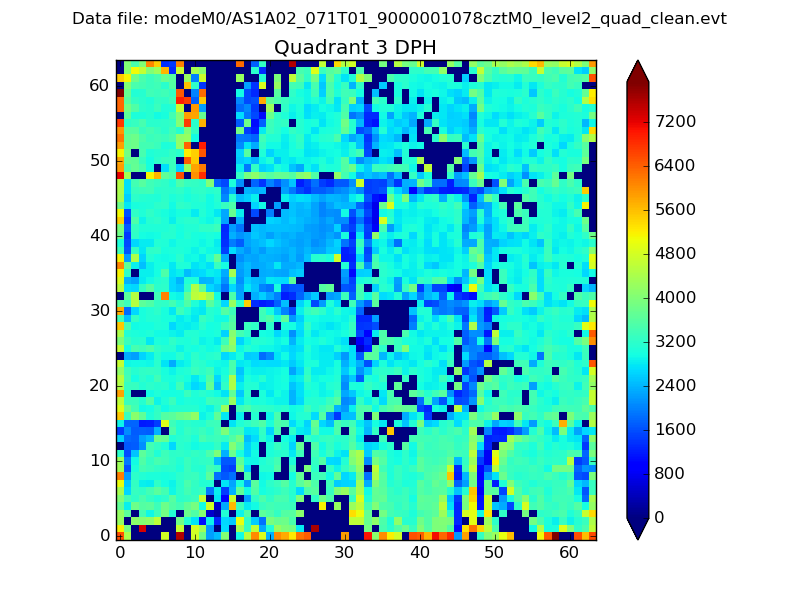 |
 |
Quadrant C |
| Plot type | Count rate plots | Images |
|---|---|---|
| Comparison with Poisson distribution Blue bars denote a histogram of data divided into 1 sec bins. Red curve is a Poisson curve with rate = median count rate of data. |
 |
 |
| Quadrant-wise count rates Data is divided into 100 sec bins |
 |
|
| Module-wise count rates for Quadrant A Data is divided into 100 sec bins |
 |
 |
| Module-wise count rates for Quadrant B Data is divided into 100 sec bins |
 |
 |
| Module-wise count rates for Quadrant C Data is divided into 100 sec bins |
 |
 |
| Module-wise count rates for Quadrant D Data is divided into 100 sec bins |
 |
 |
| Parameter | Plot |
|---|---|
| CZT HV Monitor |  |
| D_VDD |  |
| Temperature 1 | 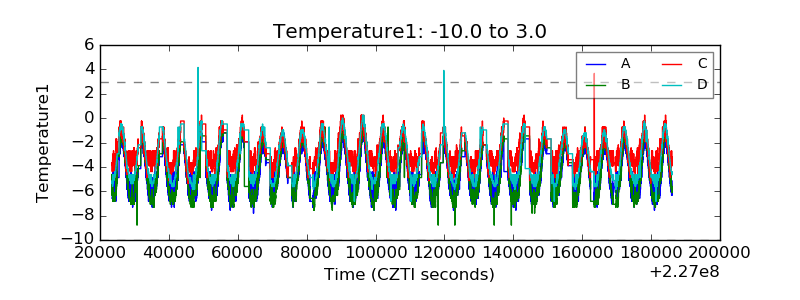 |
| Veto HV Monitor |  |
| Veto LLD |  |
| Alpha Counter |  |
| _CPM_Rate |  |
| CZT Counter |  |
| +2.5 Volts monitor |  |
| +5 Volts monitor |  |
| _ROLL_ROT |  |
| _Roll_DEC |  |
| _Roll_RA |  |
| Veto Counter |  |