| Param | Original file | Final file |
|---|---|---|
| Filename | modeM0/AS1G06_032T01_9000001074cztM0_level2.evt | modeM0/AS1G06_032T01_9000001074cztM0_level2_quad_clean.evt |
| Size (bytes) | 7,011,429,120 | 1,552,890,240 |
| Size | 6.5 GB | 1.4 GB |
| Events in quadrant A | 48,180,420 | 10,028,702 |
| Events in quadrant B | 52,212,915 | 10,346,742 |
| Events in quadrant C | 49,724,594 | 9,939,792 |
| Events in quadrant D | 55,022,788 | 9,413,823 |
| Mode M9 | |||
|---|---|---|---|
| Quadrant | BADHDUFLAG | Total packets | Discarded packets |
| A | 0 | 171 | 0 |
| B | 0 | 173 | 0 |
| C | 0 | 174 | 0 |
| D | 0 | 174 | 0 |
| Mode M0 | |||
|---|---|---|---|
| Quadrant | BADHDUFLAG | Total packets | Discarded packets |
| A | 0 | 217462 | 0 |
| B | 0 | 225498 | 0 |
| C | 0 | 222228 | 0 |
| D | 0 | 239614 | 0 |
| Mode SS | |||
|---|---|---|---|
| Quadrant | BADHDUFLAG | Total packets | Discarded packets |
| A | 0 | 2182 | 0 |
| B | 0 | 2178 | 0 |
| C | 0 | 2182 | 0 |
| D | 0 | 2168 | 0 |
| Quadrant | Total seconds | Saturated seconds | Saturation percentage |
|---|---|---|---|
| A | 106649 | 1047 | 0.981725% |
| B | 106641 | 1442 | 1.352200% |
| C | 106609 | 1051 | 0.985845% |
| D | 106582 | 2171 | 2.036929% |
Noise dominated data is calculated using 1-second bins in cleaned event files. If a bin has >2000 counts, and if more than 50% of those come from <1% of pixels, then it is considered to be noise-dominated and hence unusable.
| Quadrant | # 1 sec bins | Bins with >0 counts | Bins with >2000 counts | High rate bins dominated by noise | Noise dominated (total time) | Noise dominated (detector-on time) | Marked lightcurve |
|---|---|---|---|---|---|---|---|
| A | 125215 | 107239 | 30 | 30 | 0.02% | 0.03% |  |
| B | 125215 | 107215 | 212 | 212 | 0.17% | 0.20% |  |
| C | 125215 | 107223 | 224 | 224 | 0.18% | 0.21% |  |
| D | 125214 | 107181 | 1197 | 1197 | 0.96% | 1.12% |  |
Top three noisy pixels from each quadrant. If the there are fewer than three noisy pixels in the level2.evt file, extra rows are filled as -1
| Pixel properties | Quadrant properties | ||||||
|---|---|---|---|---|---|---|---|
| Quadrant | DetID | PixID | Counts | Sigma | Mean | Median | Sigma |
| A | 13 | 14 | 173067 | 64.95 | 12391 | 12122 | 2477.9 |
| A | 15 | 174 | 126736 | 46.25 | 12391 | 12122 | 2477.9 |
| A | 15 | 239 | 124248 | 45.25 | 12391 | 12122 | 2477.9 |
| B | 4 | 239 | 911294 | 385.76 | 12570 | 12282 | 2330.5 |
| B | 11 | 51 | 487378 | 203.86 | 12570 | 12282 | 2330.5 |
| B | 0 | 219 | 453981 | 189.53 | 12570 | 12282 | 2330.5 |
| C | 4 | 254 | 1587802 | 564.11 | 12178 | 12239 | 2793.0 |
| C | 9 | 243 | 240452 | 81.71 | 12178 | 12239 | 2793.0 |
| C | 1 | 16 | 221222 | 74.82 | 12178 | 12239 | 2793.0 |
| D | 2 | 152 | 3604917 | 1237.34 | 12046 | 11683 | 2904.0 |
| D | 12 | 233 | 1580859 | 540.35 | 12046 | 11683 | 2904.0 |
| D | 13 | 137 | 922165 | 313.53 | 12046 | 11683 | 2904.0 |
Histogram calculated using DETX and DETY for each event in the final _common_clean file
| Quadrant A |  |
 |
Quadrant B |
|---|---|---|---|
| Quadrant D | 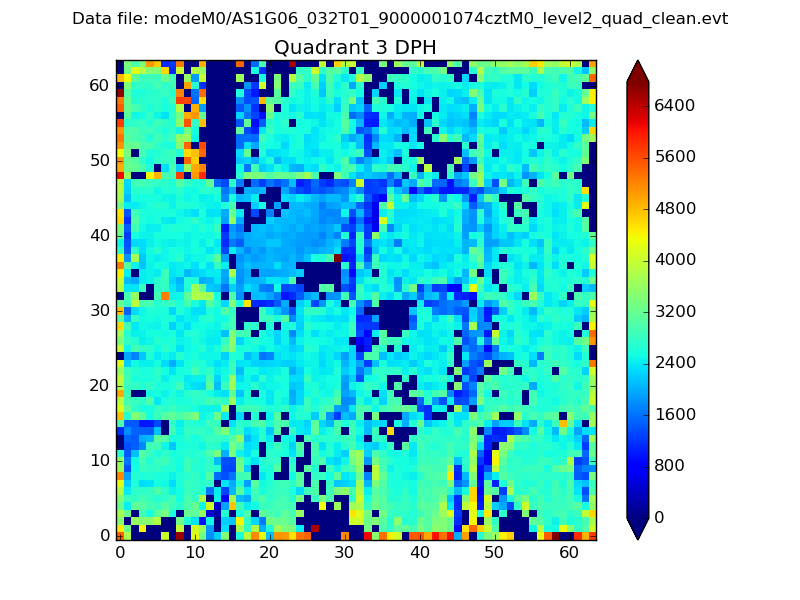 |
 |
Quadrant C |
| Plot type | Count rate plots | Images |
|---|---|---|
| Comparison with Poisson distribution Blue bars denote a histogram of data divided into 1 sec bins. Red curve is a Poisson curve with rate = median count rate of data. |
 |
 |
| Quadrant-wise count rates Data is divided into 100 sec bins |
 |
|
| Module-wise count rates for Quadrant A Data is divided into 100 sec bins |
 |
 |
| Module-wise count rates for Quadrant B Data is divided into 100 sec bins |
 |
 |
| Module-wise count rates for Quadrant C Data is divided into 100 sec bins |
 |
 |
| Module-wise count rates for Quadrant D Data is divided into 100 sec bins |
 |
 |
| Parameter | Plot |
|---|---|
| CZT HV Monitor |  |
| D_VDD |  |
| Temperature 1 |  |
| Veto HV Monitor |  |
| Veto LLD |  |
| Alpha Counter | 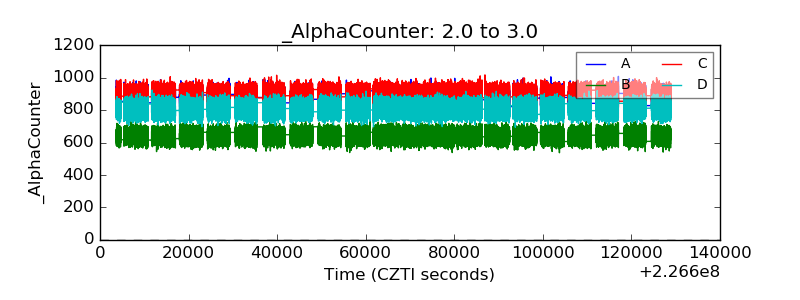 |
| _CPM_Rate |  |
| CZT Counter |  |
| +2.5 Volts monitor |  |
| +5 Volts monitor |  |
| _ROLL_ROT |  |
| _Roll_DEC |  |
| _Roll_RA |  |
| Veto Counter |  |