| Param | Original file | Final file |
|---|---|---|
| Filename | modeM0/AS1A02_132T01_9000001072cztM0_level2.evt | modeM0/AS1A02_132T01_9000001072cztM0_level2_quad_clean.evt |
| Size (bytes) | 2,349,671,040 | 399,214,080 |
| Size | 2.2 GB | 380.7 MB |
| Events in quadrant A | 15,359,910 | 2,469,913 |
| Events in quadrant B | 16,334,036 | 2,519,930 |
| Events in quadrant C | 16,030,781 | 2,492,810 |
| Events in quadrant D | 21,193,131 | 2,326,608 |
| Mode SS | |||
|---|---|---|---|
| Quadrant | BADHDUFLAG | Total packets | Discarded packets |
| A | 0 | 674 | 0 |
| B | 0 | 674 | 0 |
| C | 0 | 674 | 0 |
| D | 0 | 674 | 0 |
| Mode M9 | |||
|---|---|---|---|
| Quadrant | BADHDUFLAG | Total packets | Discarded packets |
| A | 0 | 24 | 0 |
| B | 0 | 24 | 0 |
| C | 0 | 24 | 0 |
| D | 0 | 24 | 0 |
| Mode M0 | |||
|---|---|---|---|
| Quadrant | BADHDUFLAG | Total packets | Discarded packets |
| A | 0 | 68524 | 0 |
| B | 0 | 70013 | 0 |
| C | 0 | 70641 | 0 |
| D | 0 | 85637 | 0 |
| Quadrant | Total seconds | Saturated seconds | Saturation percentage |
|---|---|---|---|
| A | 33196 | 777 | 2.340643% |
| B | 33197 | 783 | 2.358647% |
| C | 33197 | 726 | 2.186945% |
| D | 33197 | 1755 | 5.286622% |
Noise dominated data is calculated using 1-second bins in cleaned event files. If a bin has >2000 counts, and if more than 50% of those come from <1% of pixels, then it is considered to be noise-dominated and hence unusable.
| Quadrant | # 1 sec bins | Bins with >0 counts | Bins with >2000 counts | High rate bins dominated by noise | Noise dominated (total time) | Noise dominated (detector-on time) | Marked lightcurve |
|---|---|---|---|---|---|---|---|
| A | 35306 | 33201 | 1 | 1 | 0.00% | 0.00% |  |
| B | 35306 | 33201 | 13 | 13 | 0.04% | 0.04% |  |
| C | 35306 | 33201 | 141 | 141 | 0.40% | 0.42% |  |
| D | 35306 | 33201 | 1051 | 1051 | 2.98% | 3.17% |  |
Top three noisy pixels from each quadrant. If the there are fewer than three noisy pixels in the level2.evt file, extra rows are filled as -1
| Pixel properties | Quadrant properties | ||||||
|---|---|---|---|---|---|---|---|
| Quadrant | DetID | PixID | Counts | Sigma | Mean | Median | Sigma |
| A | 0 | 226 | 37762 | 41.7 | 3983 | 3888 | 812.4 |
| A | 12 | 194 | 34540 | 37.73 | 3983 | 3888 | 812.4 |
| A | 13 | 248 | 17181 | 16.36 | 3983 | 3888 | 812.4 |
| B | 4 | 239 | 185000 | 235.3 | 4014 | 3912 | 769.6 |
| B | 0 | 219 | 137284 | 173.3 | 4014 | 3912 | 769.6 |
| B | 0 | 214 | 120015 | 150.86 | 4014 | 3912 | 769.6 |
| C | 4 | 254 | 440386 | 478.56 | 3901 | 3914 | 912.1 |
| C | 9 | 68 | 310624 | 336.28 | 3901 | 3914 | 912.1 |
| C | 1 | 16 | 46642 | 46.85 | 3901 | 3914 | 912.1 |
| D | 1 | 52 | 3006634 | 3194.87 | 3855 | 3740 | 939.9 |
| D | 2 | 152 | 1724818 | 1831.1 | 3855 | 3740 | 939.9 |
| D | 13 | 104 | 775658 | 821.27 | 3855 | 3740 | 939.9 |
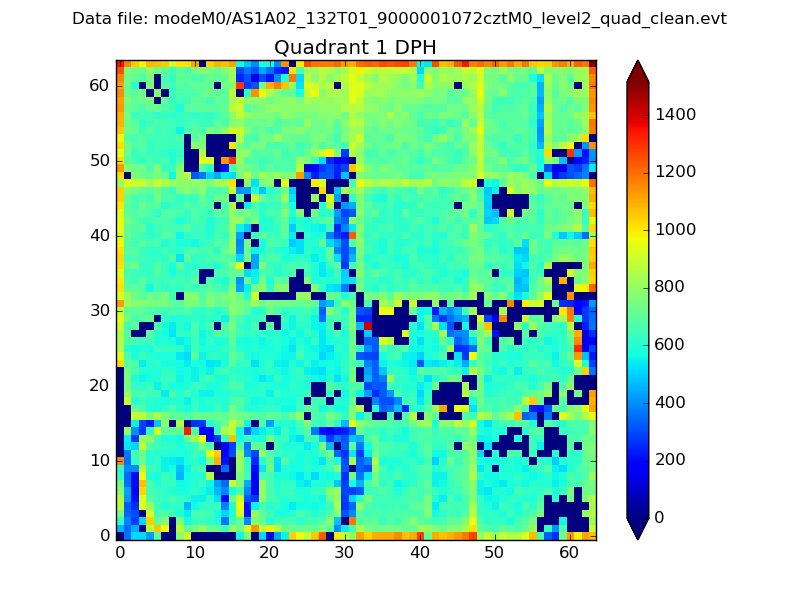
Histogram calculated using DETX and DETY for each event in the final _common_clean file
| Quadrant A |  |
 |
Quadrant B |
|---|---|---|---|
| Quadrant D |  |
 |
Quadrant C |
| Plot type | Count rate plots | Images |
|---|---|---|
| Comparison with Poisson distribution Blue bars denote a histogram of data divided into 1 sec bins. Red curve is a Poisson curve with rate = median count rate of data. |
 |
 |
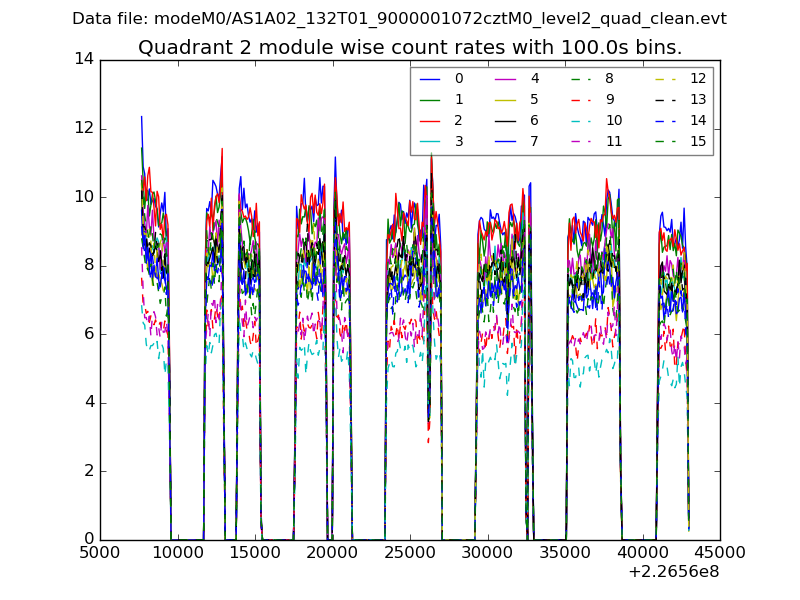
| Quadrant-wise count rates Data is divided into 100 sec bins |
 |
|
| Module-wise count rates for Quadrant A Data is divided into 100 sec bins |
 |
 |
| Module-wise count rates for Quadrant B Data is divided into 100 sec bins |
 |
 |
| Module-wise count rates for Quadrant C Data is divided into 100 sec bins |
 |
 |
| Module-wise count rates for Quadrant D Data is divided into 100 sec bins |
 |
 |
| Parameter | Plot |
|---|---|
| CZT HV Monitor | 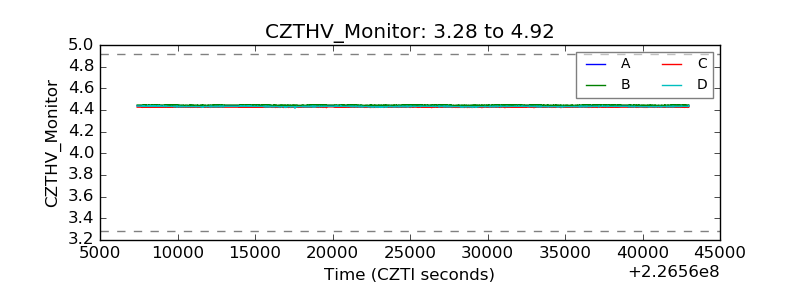 |
| D_VDD | 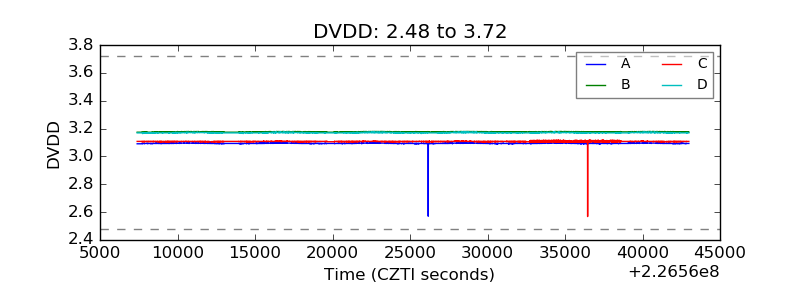 |
| Temperature 1 |  |
| Veto HV Monitor |  |
| Veto LLD |  |
| Alpha Counter |  |
| _CPM_Rate |  |
| CZT Counter |  |
| +2.5 Volts monitor |  |
| +5 Volts monitor | 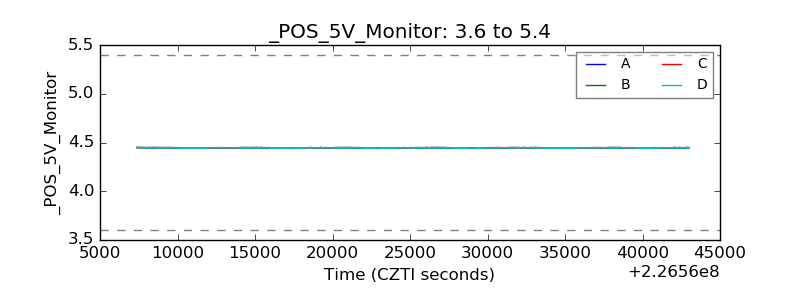 |
| _ROLL_ROT |  |
| _Roll_DEC | 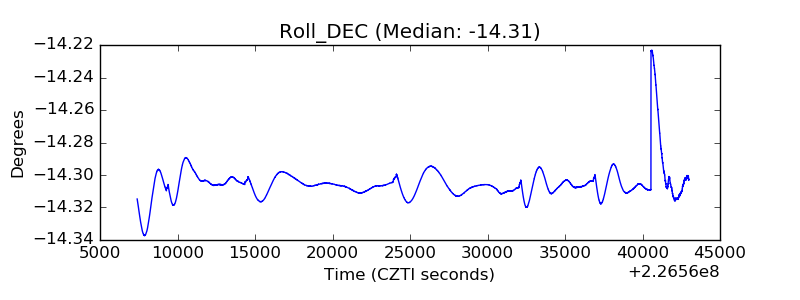 |
| _Roll_RA | 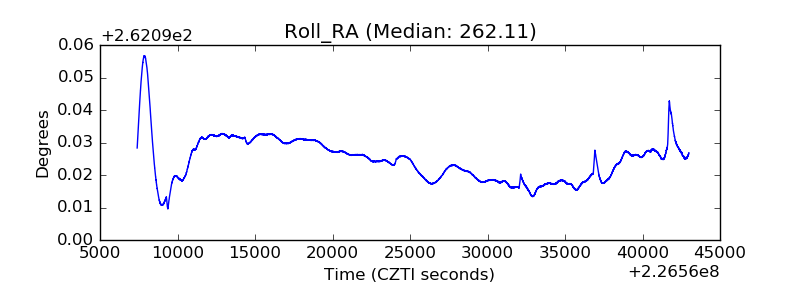 |
| Veto Counter | 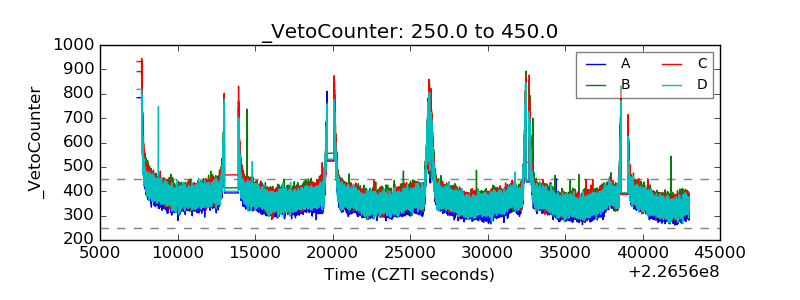 |