| Param | Original file | Final file |
|---|---|---|
| Filename | modeM0/AS1G06_169T01_9000001070cztM0_level2.evt | modeM0/AS1G06_169T01_9000001070cztM0_level2_quad_clean.evt |
| Size (bytes) | 1,581,782,400 | 274,052,160 |
| Size | 1.5 GB | 261.4 MB |
| Events in quadrant A | 10,865,630 | 1,689,066 |
| Events in quadrant B | 11,432,352 | 1,728,001 |
| Events in quadrant C | 10,776,076 | 1,671,994 |
| Events in quadrant D | 13,234,711 | 1,586,569 |
| Mode M9 | |||
|---|---|---|---|
| Quadrant | BADHDUFLAG | Total packets | Discarded packets |
| A | 0 | 51 | 0 |
| B | 0 | 51 | 0 |
| C | 0 | 51 | 0 |
| D | 0 | 51 | 0 |
| Mode M0 | |||
|---|---|---|---|
| Quadrant | BADHDUFLAG | Total packets | Discarded packets |
| A | 0 | 48030 | 0 |
| B | 0 | 49171 | 0 |
| C | 0 | 48105 | 0 |
| D | 0 | 54442 | 0 |
| Mode SS | |||
|---|---|---|---|
| Quadrant | BADHDUFLAG | Total packets | Discarded packets |
| A | 0 | 478 | 0 |
| B | 0 | 478 | 0 |
| C | 0 | 478 | 0 |
| D | 0 | 478 | 0 |
| Quadrant | Total seconds | Saturated seconds | Saturation percentage |
|---|---|---|---|
| A | 23621 | 74 | 0.313281% |
| B | 23621 | 107 | 0.452987% |
| C | 23621 | 38 | 0.160874% |
| D | 23621 | 213 | 0.901740% |
Noise dominated data is calculated using 1-second bins in cleaned event files. If a bin has >2000 counts, and if more than 50% of those come from <1% of pixels, then it is considered to be noise-dominated and hence unusable.
| Quadrant | # 1 sec bins | Bins with >0 counts | Bins with >2000 counts | High rate bins dominated by noise | Noise dominated (total time) | Noise dominated (detector-on time) | Marked lightcurve |
|---|---|---|---|---|---|---|---|
| A | 28621 | 23624 | 1 | 1 | 0.00% | 0.00% |  |
| B | 28621 | 23624 | 11 | 11 | 0.04% | 0.05% |  |
| C | 28621 | 23623 | 0 | 0 | 0.00% | 0.00% |  |
| D | 28621 | 23625 | 145 | 145 | 0.51% | 0.61% |  |
Top three noisy pixels from each quadrant. If the there are fewer than three noisy pixels in the level2.evt file, extra rows are filled as -1
| Pixel properties | Quadrant properties | ||||||
|---|---|---|---|---|---|---|---|
| Quadrant | DetID | PixID | Counts | Sigma | Mean | Median | Sigma |
| A | 0 | 226 | 26763 | 42.32 | 2820 | 2761 | 567.2 |
| A | 12 | 194 | 24622 | 38.54 | 2820 | 2761 | 567.2 |
| A | 13 | 254 | 10952 | 14.44 | 2820 | 2761 | 567.2 |
| B | 0 | 214 | 90539 | 164.36 | 2847 | 2785 | 533.9 |
| B | 4 | 81 | 63032 | 112.84 | 2847 | 2785 | 533.9 |
| B | 0 | 213 | 55843 | 99.38 | 2847 | 2785 | 533.9 |
| C | 1 | 16 | 68947 | 105.21 | 2734 | 2747 | 629.2 |
| C | 12 | 16 | 29072 | 41.84 | 2734 | 2747 | 629.2 |
| C | 12 | 4 | 21978 | 30.56 | 2734 | 2747 | 629.2 |
| D | 1 | 52 | 1667015 | 2522.93 | 2711 | 2628 | 659.7 |
| D | 2 | 152 | 557926 | 841.74 | 2711 | 2628 | 659.7 |
| D | 13 | 104 | 226099 | 338.74 | 2711 | 2628 | 659.7 |
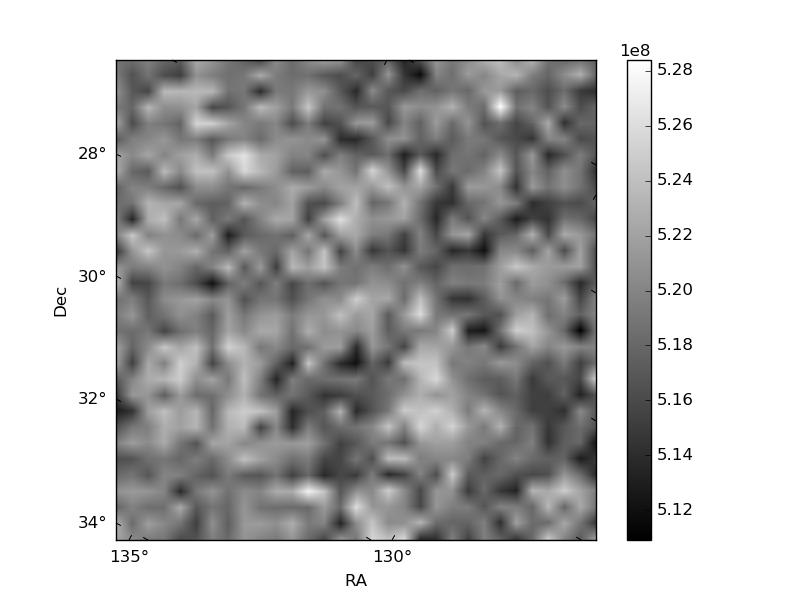
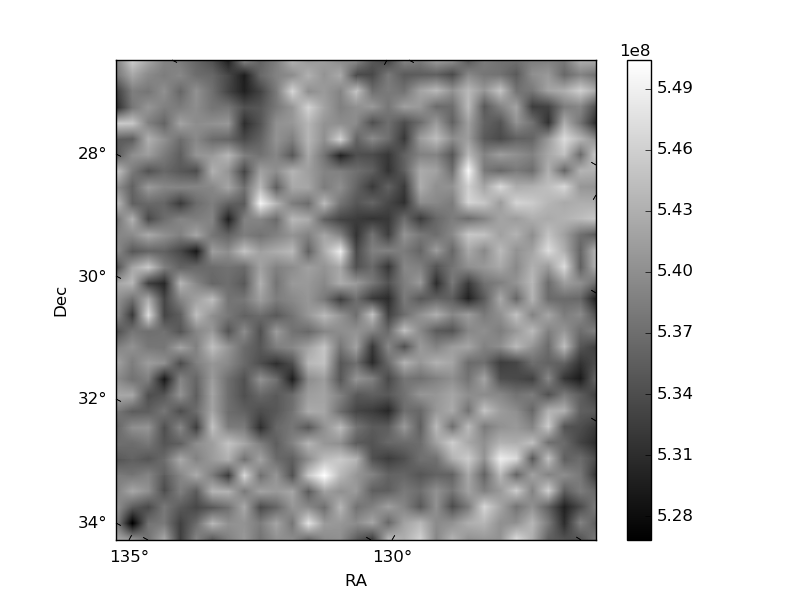
Histogram calculated using DETX and DETY for each event in the final _common_clean file
| Quadrant A | 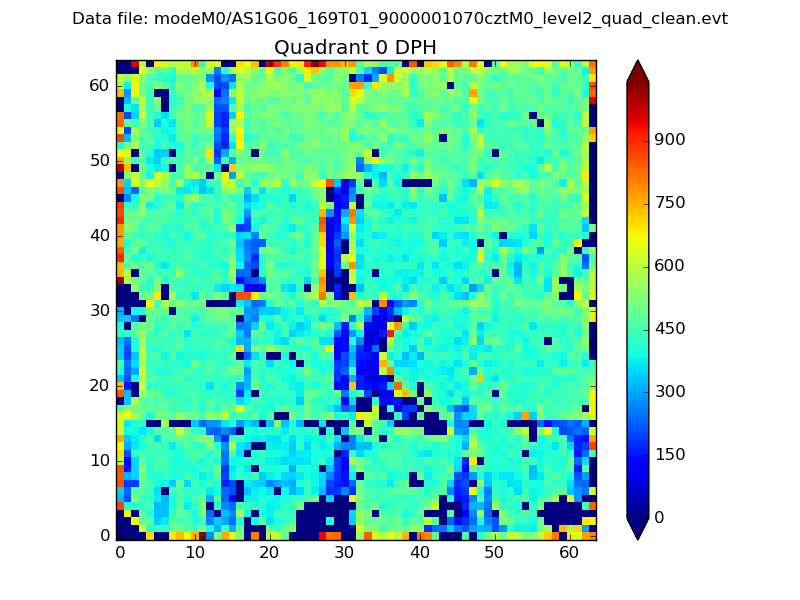 |
 |
Quadrant B |
|---|---|---|---|
| Quadrant D | 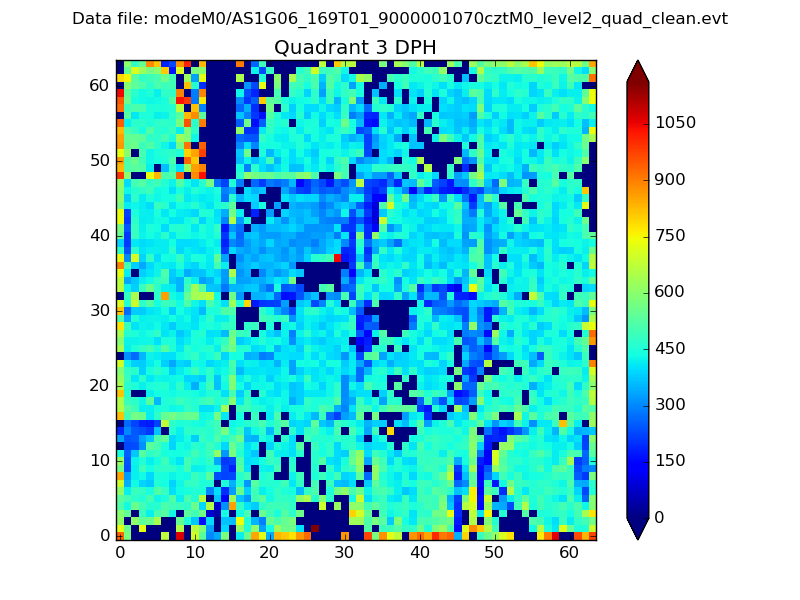 |
 |
Quadrant C |
| Plot type | Count rate plots | Images |
|---|---|---|
| Comparison with Poisson distribution Blue bars denote a histogram of data divided into 1 sec bins. Red curve is a Poisson curve with rate = median count rate of data. |
 |
 |
| Quadrant-wise count rates Data is divided into 100 sec bins |
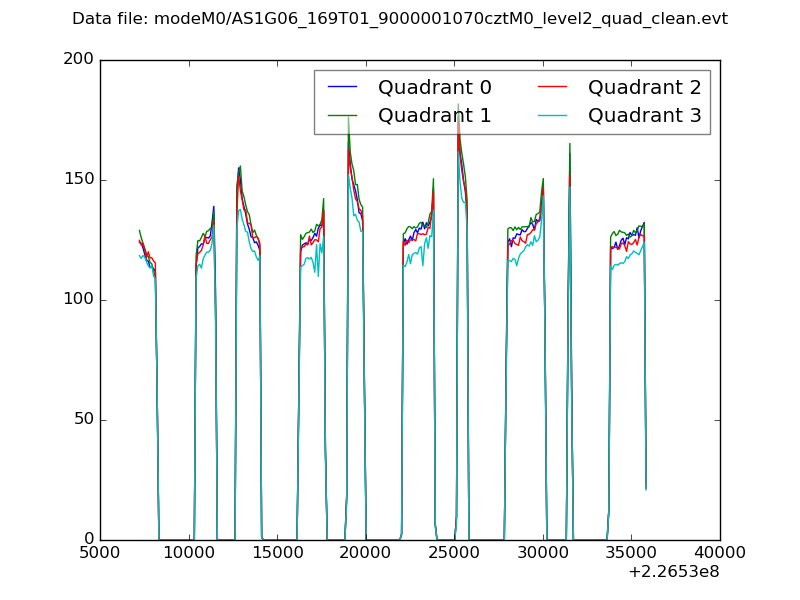 |
|
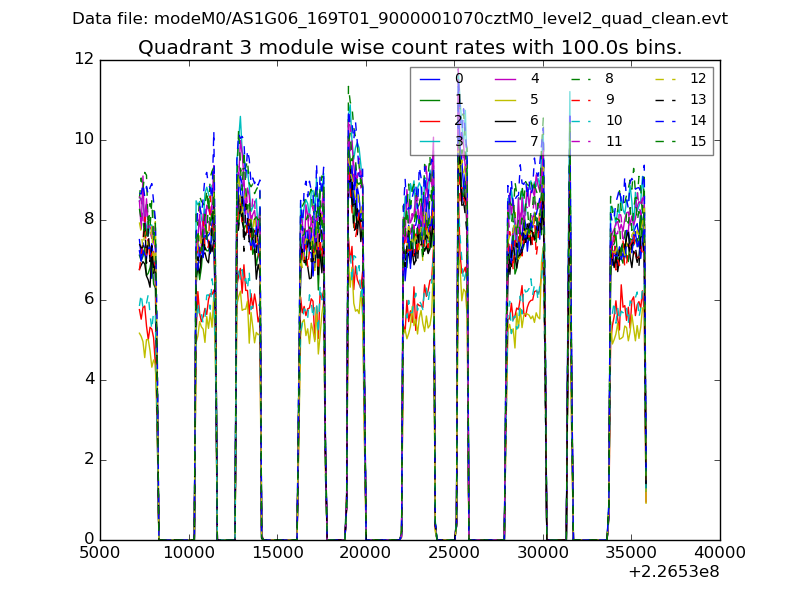
| Module-wise count rates for Quadrant A Data is divided into 100 sec bins |
 |
 |
| Module-wise count rates for Quadrant B Data is divided into 100 sec bins |
 |
 |
| Module-wise count rates for Quadrant C Data is divided into 100 sec bins |
 |
 |
| Module-wise count rates for Quadrant D Data is divided into 100 sec bins |
 |
 |
| Parameter | Plot |
|---|---|
| CZT HV Monitor | 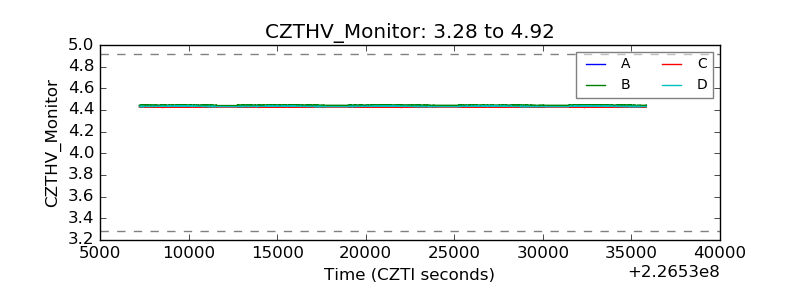 |
| D_VDD | 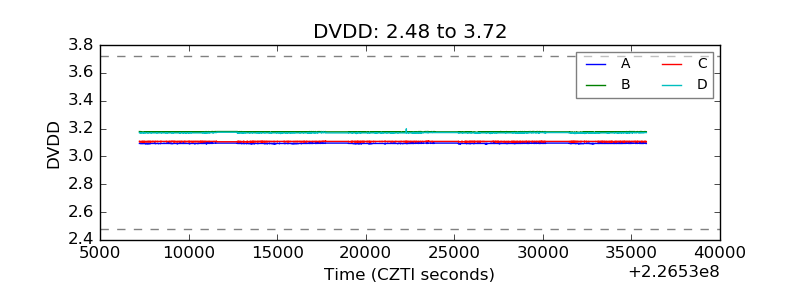 |
| Temperature 1 |  |
| Veto HV Monitor |  |
| Veto LLD |  |
| Alpha Counter |  |
| _CPM_Rate |  |
| CZT Counter |  |
| +2.5 Volts monitor |  |
| +5 Volts monitor | 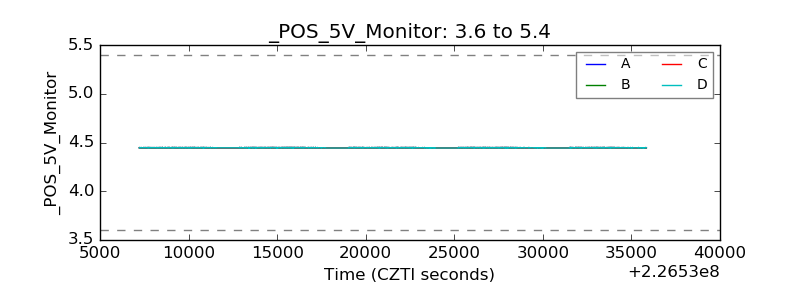 |
| _ROLL_ROT |  |
| _Roll_DEC |  |
| _Roll_RA | 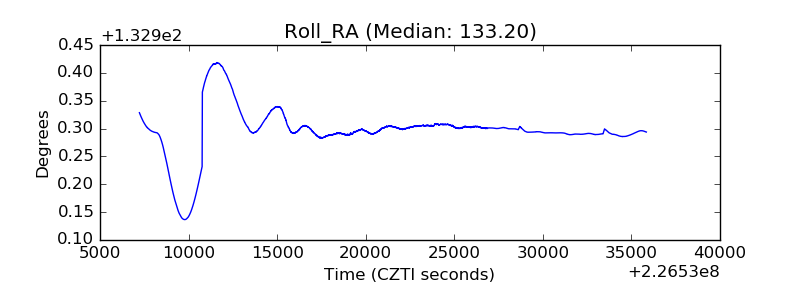 |
| Veto Counter |  |