| Param | Original file | Final file |
|---|---|---|
| Filename | modeM0/AS1A02_132T01_9000001068cztM0_level2.evt | modeM0/AS1A02_132T01_9000001068cztM0_level2_quad_clean.evt |
| Size (bytes) | 7,981,246,080 | 1,474,344,000 |
| Size | 7.4 GB | 1.4 GB |
| Events in quadrant A | 54,912,106 | 9,186,753 |
| Events in quadrant B | 58,499,455 | 9,347,132 |
| Events in quadrant C | 54,512,982 | 9,313,557 |
| Events in quadrant D | 65,832,966 | 8,730,788 |
| Mode M9 | |||
|---|---|---|---|
| Quadrant | BADHDUFLAG | Total packets | Discarded packets |
| A | 0 | 150 | 0 |
| B | 0 | 150 | 0 |
| C | 0 | 150 | 0 |
| D | 0 | 150 | 0 |
| Mode M0 | |||
|---|---|---|---|
| Quadrant | BADHDUFLAG | Total packets | Discarded packets |
| A | 0 | 243261 | 0 |
| B | 0 | 250952 | 0 |
| C | 0 | 242666 | 0 |
| D | 0 | 276686 | 0 |
| Mode SS | |||
|---|---|---|---|
| Quadrant | BADHDUFLAG | Total packets | Discarded packets |
| A | 0 | 2404 | 0 |
| B | 0 | 2406 | 0 |
| C | 0 | 2406 | 0 |
| D | 0 | 2406 | 0 |
| Quadrant | Total seconds | Saturated seconds | Saturation percentage |
|---|---|---|---|
| A | 117879 | 2002 | 1.698352% |
| B | 117883 | 2334 | 1.979929% |
| C | 117880 | 1368 | 1.160502% |
| D | 117877 | 3393 | 2.878424% |
Noise dominated data is calculated using 1-second bins in cleaned event files. If a bin has >2000 counts, and if more than 50% of those come from <1% of pixels, then it is considered to be noise-dominated and hence unusable.
| Quadrant | # 1 sec bins | Bins with >0 counts | Bins with >2000 counts | High rate bins dominated by noise | Noise dominated (total time) | Noise dominated (detector-on time) | Marked lightcurve |
|---|---|---|---|---|---|---|---|
| A | 132738 | 117903 | 16 | 16 | 0.01% | 0.01% |  |
| B | 132737 | 117902 | 172 | 172 | 0.13% | 0.15% | 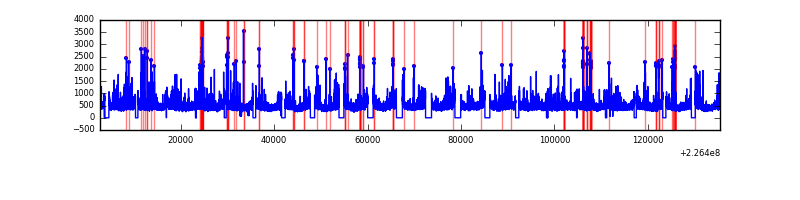 |
| C | 132738 | 117907 | 3 | 3 | 0.00% | 0.00% |  |
| D | 132737 | 117902 | 1589 | 1589 | 1.20% | 1.35% |  |
Top three noisy pixels from each quadrant. If the there are fewer than three noisy pixels in the level2.evt file, extra rows are filled as -1
| Pixel properties | Quadrant properties | ||||||
|---|---|---|---|---|---|---|---|
| Quadrant | DetID | PixID | Counts | Sigma | Mean | Median | Sigma |
| A | 0 | 226 | 134066 | 41.7 | 14180 | 13868 | 2882.5 |
| A | 12 | 194 | 125909 | 38.87 | 14180 | 13868 | 2882.5 |
| A | 0 | 128 | 92472 | 27.27 | 14180 | 13868 | 2882.5 |
| B | 4 | 173 | 869414 | 314.63 | 14299 | 13956 | 2719.0 |
| B | 4 | 239 | 723717 | 261.04 | 14299 | 13956 | 2719.0 |
| B | 4 | 81 | 351473 | 124.13 | 14299 | 13956 | 2719.0 |
| C | 12 | 4 | 117659 | 32.05 | 13913 | 13999 | 3234.2 |
| C | 13 | 61 | 107102 | 28.79 | 13913 | 13999 | 3234.2 |
| C | 8 | 128 | 53925 | 12.34 | 13913 | 13999 | 3234.2 |
| D | 1 | 52 | 6470520 | 1919.44 | 13794 | 13385 | 3364.1 |
| D | 2 | 152 | 2392814 | 707.31 | 13794 | 13385 | 3364.1 |
| D | 12 | 221 | 1649554 | 486.36 | 13794 | 13385 | 3364.1 |
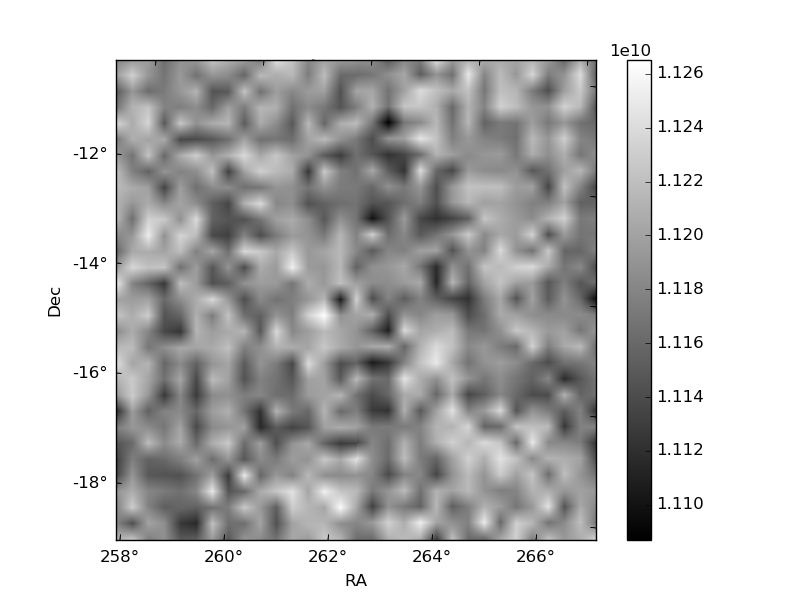
Histogram calculated using DETX and DETY for each event in the final _common_clean file
| Quadrant A |  |
 |
Quadrant B |
|---|---|---|---|
| Quadrant D |  |
 |
Quadrant C |
| Plot type | Count rate plots | Images |
|---|---|---|
| Comparison with Poisson distribution Blue bars denote a histogram of data divided into 1 sec bins. Red curve is a Poisson curve with rate = median count rate of data. |
 |
 |
| Quadrant-wise count rates Data is divided into 100 sec bins |
 |
|
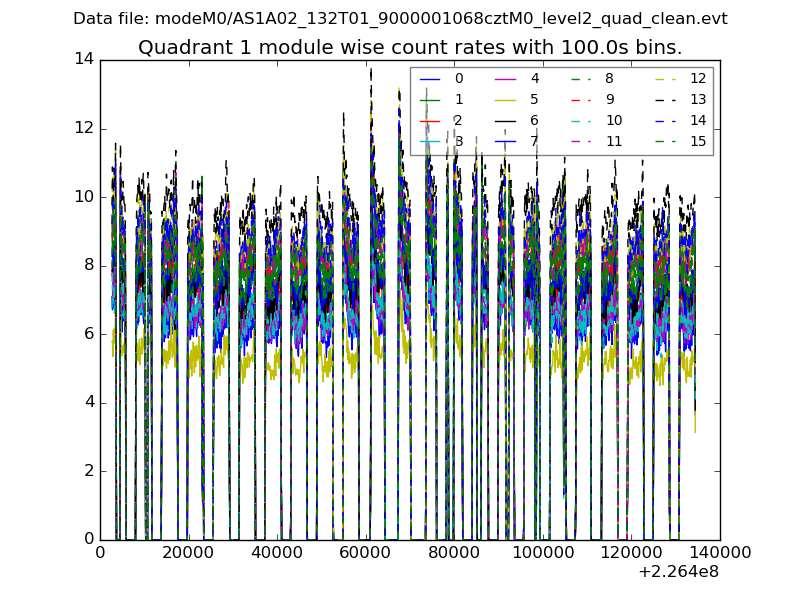
| Module-wise count rates for Quadrant A Data is divided into 100 sec bins |
 |
 |
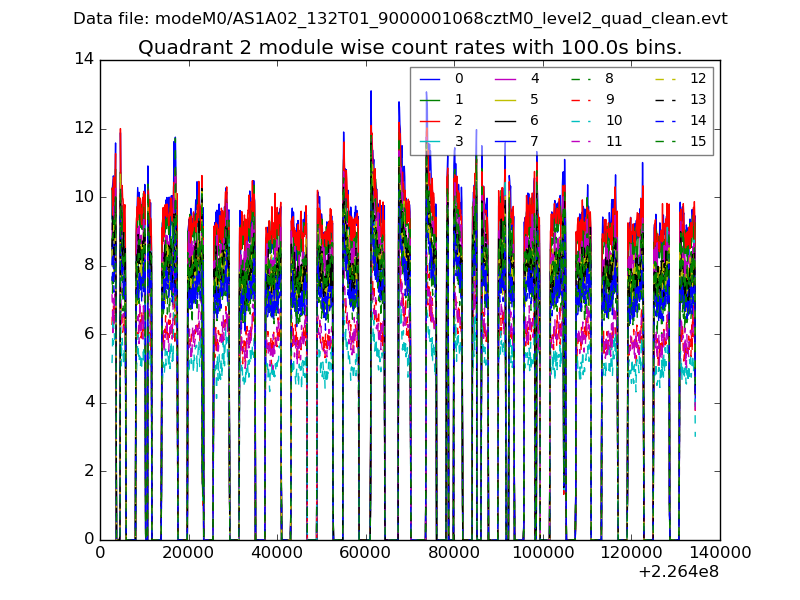
| Module-wise count rates for Quadrant B Data is divided into 100 sec bins |
 |
 |
| Module-wise count rates for Quadrant C Data is divided into 100 sec bins |
 |
 |
| Module-wise count rates for Quadrant D Data is divided into 100 sec bins |
 |
 |
| Parameter | Plot |
|---|---|
| CZT HV Monitor |  |
| D_VDD |  |
| Temperature 1 |  |
| Veto HV Monitor |  |
| Veto LLD |  |
| Alpha Counter |  |
| _CPM_Rate | 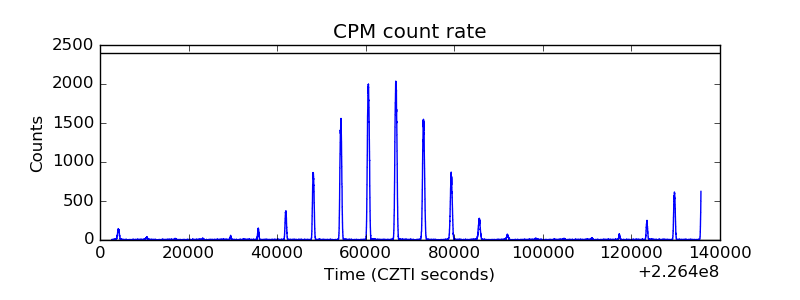 |
| CZT Counter |  |
| +2.5 Volts monitor |  |
| +5 Volts monitor |  |
| _ROLL_ROT |  |
| _Roll_DEC |  |
| _Roll_RA |  |
| Veto Counter |  |