| Param | Original file | Final file |
|---|---|---|
| Filename | modeM0/AS1A02_158T01_9000001064cztM0_level2.evt | modeM0/AS1A02_158T01_9000001064cztM0_level2_quad_clean.evt |
| Size (bytes) | 3,383,896,320 | 581,440,320 |
| Size | 3.2 GB | 554.5 MB |
| Events in quadrant A | 23,157,870 | 3,616,619 |
| Events in quadrant B | 23,579,666 | 3,688,006 |
| Events in quadrant C | 23,422,866 | 3,636,458 |
| Events in quadrant D | 29,090,678 | 3,384,573 |
| Mode SS | |||
|---|---|---|---|
| Quadrant | BADHDUFLAG | Total packets | Discarded packets |
| A | 0 | 972 | 0 |
| B | 0 | 972 | 0 |
| C | 0 | 972 | 0 |
| D | 0 | 972 | 0 |
| Mode M9 | |||
|---|---|---|---|
| Quadrant | BADHDUFLAG | Total packets | Discarded packets |
| A | 0 | 95 | 0 |
| B | 0 | 95 | 0 |
| C | 0 | 95 | 0 |
| D | 0 | 95 | 0 |
| Mode M0 | |||
|---|---|---|---|
| Quadrant | BADHDUFLAG | Total packets | Discarded packets |
| A | 0 | 100436 | 0 |
| B | 0 | 100942 | 0 |
| C | 0 | 101252 | 0 |
| D | 0 | 118660 | 0 |
| Quadrant | Total seconds | Saturated seconds | Saturation percentage |
|---|---|---|---|
| A | 47876 | 672 | 1.403626% |
| B | 47876 | 658 | 1.374384% |
| C | 47876 | 581 | 1.213552% |
| D | 47876 | 2499 | 5.219734% |
Noise dominated data is calculated using 1-second bins in cleaned event files. If a bin has >2000 counts, and if more than 50% of those come from <1% of pixels, then it is considered to be noise-dominated and hence unusable.
| Quadrant | # 1 sec bins | Bins with >0 counts | Bins with >2000 counts | High rate bins dominated by noise | Noise dominated (total time) | Noise dominated (detector-on time) | Marked lightcurve |
|---|---|---|---|---|---|---|---|
| A | 57271 | 47883 | 104 | 104 | 0.18% | 0.22% |  |
| B | 57271 | 47881 | 64 | 64 | 0.11% | 0.13% |  |
| C | 57271 | 47883 | 105 | 105 | 0.18% | 0.22% |  |
| D | 57271 | 47882 | 1896 | 1896 | 3.31% | 3.96% |  |
Top three noisy pixels from each quadrant. If the there are fewer than three noisy pixels in the level2.evt file, extra rows are filled as -1
| Pixel properties | Quadrant properties | ||||||
|---|---|---|---|---|---|---|---|
| Quadrant | DetID | PixID | Counts | Sigma | Mean | Median | Sigma |
| A | 15 | 234 | 431482 | 365.45 | 5806 | 5687 | 1165.1 |
| A | 0 | 23 | 244258 | 204.76 | 5806 | 5687 | 1165.1 |
| A | 0 | 226 | 71604 | 56.58 | 5806 | 5687 | 1165.1 |
| B | 4 | 239 | 238673 | 212.51 | 5840 | 5700 | 1096.3 |
| B | 0 | 214 | 172408 | 152.07 | 5840 | 5700 | 1096.3 |
| B | 4 | 81 | 137600 | 120.32 | 5840 | 5700 | 1096.3 |
| C | 9 | 68 | 1117935 | 847.38 | 5690 | 5725 | 1312.5 |
| C | 8 | 229 | 48648 | 32.7 | 5690 | 5725 | 1312.5 |
| C | 13 | 61 | 44098 | 29.24 | 5690 | 5725 | 1312.5 |
| D | 1 | 239 | 2988110 | 2185.39 | 5598 | 5434 | 1364.8 |
| D | 12 | 221 | 2632536 | 1924.86 | 5598 | 5434 | 1364.8 |
| D | 13 | 105 | 628525 | 456.53 | 5598 | 5434 | 1364.8 |
Histogram calculated using DETX and DETY for each event in the final _common_clean file
| Quadrant A |  |
 |
Quadrant B |
|---|---|---|---|
| Quadrant D |  |
 |
Quadrant C |
| Plot type | Count rate plots | Images |
|---|---|---|
| Comparison with Poisson distribution Blue bars denote a histogram of data divided into 1 sec bins. Red curve is a Poisson curve with rate = median count rate of data. |
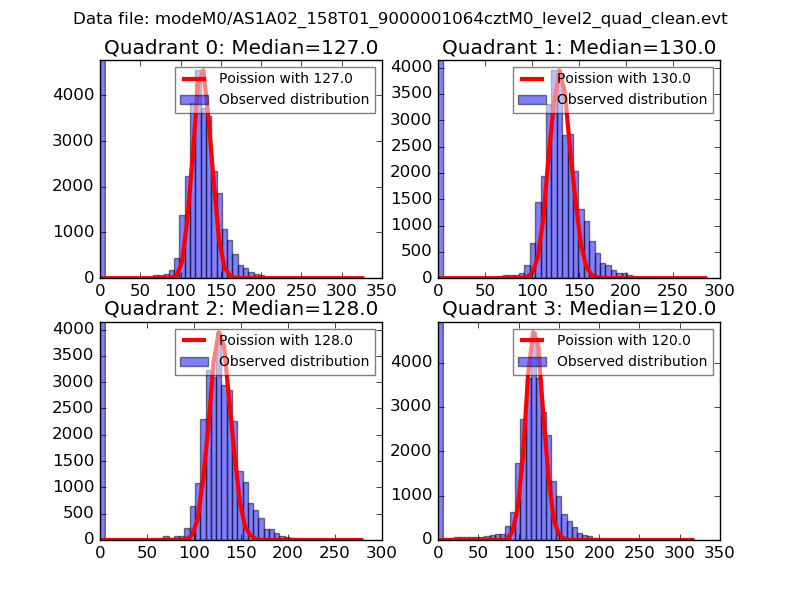 |
 |
| Quadrant-wise count rates Data is divided into 100 sec bins |
 |
|
| Module-wise count rates for Quadrant A Data is divided into 100 sec bins |
 |
 |
| Module-wise count rates for Quadrant B Data is divided into 100 sec bins |
 |
 |
| Module-wise count rates for Quadrant C Data is divided into 100 sec bins |
 |
 |
| Module-wise count rates for Quadrant D Data is divided into 100 sec bins |
 |
 |
| Parameter | Plot |
|---|---|
| CZT HV Monitor |  |
| D_VDD |  |
| Temperature 1 |  |
| Veto HV Monitor |  |
| Veto LLD |  |
| Alpha Counter |  |
| _CPM_Rate |  |
| CZT Counter |  |
| +2.5 Volts monitor |  |
| +5 Volts monitor |  |
| _ROLL_ROT |  |
| _Roll_DEC |  |
| _Roll_RA |  |
| Veto Counter |  |