| Param | Original file | Final file |
|---|---|---|
| Filename | modeM0/AS1G06_104T01_9000001060cztM0_level2.evt | modeM0/AS1G06_104T01_9000001060cztM0_level2_quad_clean.evt |
| Size (bytes) | 6,729,600,960 | 1,053,846,720 |
| Size | 6.3 GB | 1005.0 MB |
| Events in quadrant A | 37,617,207 | 6,779,519 |
| Events in quadrant B | 40,154,806 | 6,895,363 |
| Events in quadrant C | 76,450,517 | 6,350,611 |
| Events in quadrant D | 44,123,250 | 6,332,852 |
| Mode SS | |||
|---|---|---|---|
| Quadrant | BADHDUFLAG | Total packets | Discarded packets |
| A | 0 | 1656 | 0 |
| B | 0 | 1656 | 0 |
| C | 0 | 1656 | 0 |
| D | 0 | 1656 | 0 |
| Mode M0 | |||
|---|---|---|---|
| Quadrant | BADHDUFLAG | Total packets | Discarded packets |
| A | 0 | 166508 | 0 |
| B | 0 | 171951 | 0 |
| C | 0 | 281876 | 0 |
| D | 0 | 186883 | 0 |
| Mode M9 | |||
|---|---|---|---|
| Quadrant | BADHDUFLAG | Total packets | Discarded packets |
| A | 0 | 124 | 0 |
| B | 0 | 124 | 0 |
| C | 0 | 124 | 0 |
| D | 0 | 124 | 0 |
| Quadrant | Total seconds | Saturated seconds | Saturation percentage |
|---|---|---|---|
| A | 81094 | 987 | 1.217106% |
| B | 81094 | 1197 | 1.476065% |
| C | 81094 | 11244 | 13.865391% |
| D | 81094 | 1454 | 1.792981% |
Noise dominated data is calculated using 1-second bins in cleaned event files. If a bin has >2000 counts, and if more than 50% of those come from <1% of pixels, then it is considered to be noise-dominated and hence unusable.
| Quadrant | # 1 sec bins | Bins with >0 counts | Bins with >2000 counts | High rate bins dominated by noise | Noise dominated (total time) | Noise dominated (detector-on time) | Marked lightcurve |
|---|---|---|---|---|---|---|---|
| A | 93639 | 81109 | 21 | 21 | 0.02% | 0.03% |  |
| B | 93639 | 81109 | 75 | 75 | 0.08% | 0.09% |  |
| C | 93639 | 81108 | 10071 | 10071 | 10.76% | 12.42% |  |
| D | 93639 | 81110 | 521 | 521 | 0.56% | 0.64% |  |
Top three noisy pixels from each quadrant. If the there are fewer than three noisy pixels in the level2.evt file, extra rows are filled as -1
| Pixel properties | Quadrant properties | ||||||
|---|---|---|---|---|---|---|---|
| Quadrant | DetID | PixID | Counts | Sigma | Mean | Median | Sigma |
| A | 0 | 226 | 92664 | 42.89 | 9680 | 9469 | 1939.7 |
| A | 3 | 1 | 90446 | 41.75 | 9680 | 9469 | 1939.7 |
| A | 12 | 194 | 86501 | 39.71 | 9680 | 9469 | 1939.7 |
| B | 0 | 219 | 1093263 | 596.78 | 9735 | 9513 | 1816.0 |
| B | 4 | 239 | 299208 | 159.52 | 9735 | 9513 | 1816.0 |
| B | 4 | 173 | 254873 | 135.11 | 9735 | 9513 | 1816.0 |
| C | 9 | 68 | 39255657 | 18789.34 | 9094 | 9140 | 2088.8 |
| C | 8 | 229 | 849515 | 402.33 | 9094 | 9140 | 2088.8 |
| C | 8 | 208 | 582581 | 274.54 | 9094 | 9140 | 2088.8 |
| D | 2 | 152 | 3648505 | 1599.74 | 9414 | 9125 | 2275.0 |
| D | 1 | 83 | 1725519 | 754.46 | 9414 | 9125 | 2275.0 |
| D | 13 | 104 | 1325331 | 578.56 | 9414 | 9125 | 2275.0 |
Histogram calculated using DETX and DETY for each event in the final _common_clean file
| Quadrant A |  |
 |
Quadrant B |
|---|---|---|---|
| Quadrant D | 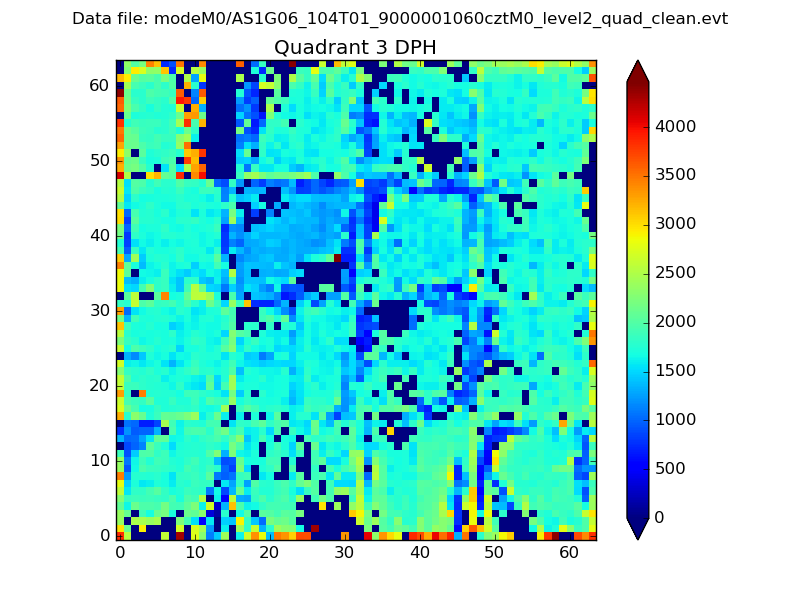 |
 |
Quadrant C |
| Plot type | Count rate plots | Images |
|---|---|---|
| Comparison with Poisson distribution Blue bars denote a histogram of data divided into 1 sec bins. Red curve is a Poisson curve with rate = median count rate of data. |
 |
 |
| Quadrant-wise count rates Data is divided into 100 sec bins |
 |
|
| Module-wise count rates for Quadrant A Data is divided into 100 sec bins |
 |
 |
| Module-wise count rates for Quadrant B Data is divided into 100 sec bins |
 |
 |
| Module-wise count rates for Quadrant C Data is divided into 100 sec bins |
 |
 |
| Module-wise count rates for Quadrant D Data is divided into 100 sec bins |
 |
 |
| Parameter | Plot |
|---|---|
| CZT HV Monitor |  |
| D_VDD |  |
| Temperature 1 |  |
| Veto HV Monitor |  |
| Veto LLD | 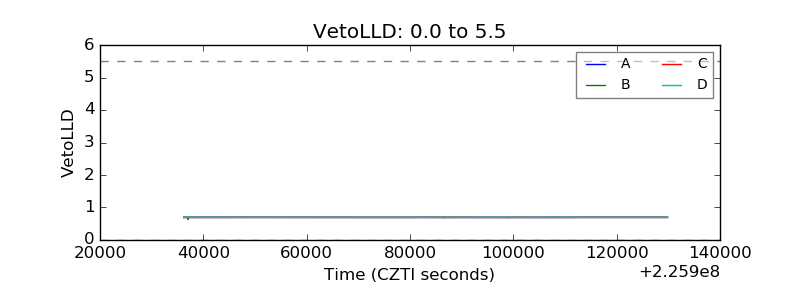 |
| Alpha Counter |  |
| _CPM_Rate |  |
| CZT Counter | 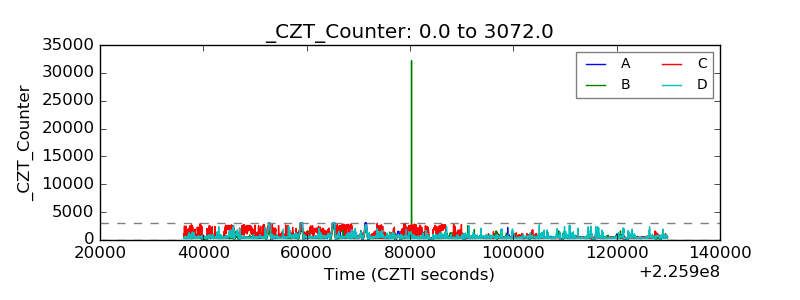 |
| +2.5 Volts monitor |  |
| +5 Volts monitor |  |
| _ROLL_ROT |  |
| _Roll_DEC |  |
| _Roll_RA |  |
| Veto Counter |  |