| Param | Original file | Final file |
|---|---|---|
| Filename | modeM0/AS1A02_029T01_9000001058cztM0_level2.evt | modeM0/AS1A02_029T01_9000001058cztM0_level2_quad_clean.evt |
| Size (bytes) | 5,155,813,440 | 635,250,240 |
| Size | 4.8 GB | 605.8 MB |
| Events in quadrant A | 25,431,830 | 4,083,142 |
| Events in quadrant B | 27,610,556 | 4,124,526 |
| Events in quadrant C | 66,741,710 | 3,487,010 |
| Events in quadrant D | 32,737,886 | 3,847,531 |
| Mode SS | |||
|---|---|---|---|
| Quadrant | BADHDUFLAG | Total packets | Discarded packets |
| A | 0 | 1098 | 0 |
| B | 0 | 1098 | 0 |
| C | 0 | 1098 | 0 |
| D | 0 | 1098 | 0 |
| Mode M0 | |||
|---|---|---|---|
| Quadrant | BADHDUFLAG | Total packets | Discarded packets |
| A | 0 | 111129 | 0 |
| B | 0 | 116568 | 0 |
| C | 0 | 234369 | 0 |
| D | 0 | 133081 | 0 |
| Mode M9 | |||
|---|---|---|---|
| Quadrant | BADHDUFLAG | Total packets | Discarded packets |
| A | 0 | 76 | 0 |
| B | 0 | 76 | 0 |
| C | 0 | 76 | 0 |
| D | 0 | 76 | 0 |
| Quadrant | Total seconds | Saturated seconds | Saturation percentage |
|---|---|---|---|
| A | 53837 | 807 | 1.498969% |
| B | 53837 | 1174 | 2.180656% |
| C | 53837 | 15927 | 29.583744% |
| D | 53837 | 1809 | 3.360143% |
Noise dominated data is calculated using 1-second bins in cleaned event files. If a bin has >2000 counts, and if more than 50% of those come from <1% of pixels, then it is considered to be noise-dominated and hence unusable.
| Quadrant | # 1 sec bins | Bins with >0 counts | Bins with >2000 counts | High rate bins dominated by noise | Noise dominated (total time) | Noise dominated (detector-on time) | Marked lightcurve |
|---|---|---|---|---|---|---|---|
| A | 61377 | 53848 | 3 | 3 | 0.00% | 0.01% |  |
| B | 61377 | 53847 | 175 | 175 | 0.29% | 0.32% |  |
| C | 61377 | 53846 | 12901 | 12901 | 21.02% | 23.96% |  |
| D | 61377 | 53848 | 916 | 916 | 1.49% | 1.70% |  |
Top three noisy pixels from each quadrant. If the there are fewer than three noisy pixels in the level2.evt file, extra rows are filled as -1
| Pixel properties | Quadrant properties | ||||||
|---|---|---|---|---|---|---|---|
| Quadrant | DetID | PixID | Counts | Sigma | Mean | Median | Sigma |
| A | 0 | 226 | 63720 | 43.3 | 6567 | 6426 | 1323.1 |
| A | 12 | 194 | 58463 | 39.33 | 6567 | 6426 | 1323.1 |
| A | 13 | 248 | 41478 | 26.49 | 6567 | 6426 | 1323.1 |
| B | 4 | 239 | 662582 | 526.84 | 6580 | 6422 | 1245.5 |
| B | 4 | 173 | 320624 | 252.28 | 6580 | 6422 | 1245.5 |
| B | 0 | 214 | 295182 | 231.85 | 6580 | 6422 | 1245.5 |
| C | 9 | 68 | 44491735 | 34051.0 | 5634 | 5668 | 1306.5 |
| C | 8 | 208 | 159666 | 117.87 | 5634 | 5668 | 1306.5 |
| C | 1 | 3 | 57914 | 39.99 | 5634 | 5668 | 1306.5 |
| D | 2 | 152 | 3207054 | 2079.59 | 6358 | 6162 | 1539.2 |
| D | 12 | 0 | 1839479 | 1191.09 | 6358 | 6162 | 1539.2 |
| D | 13 | 104 | 1240507 | 801.94 | 6358 | 6162 | 1539.2 |
Histogram calculated using DETX and DETY for each event in the final _common_clean file
| Quadrant A | 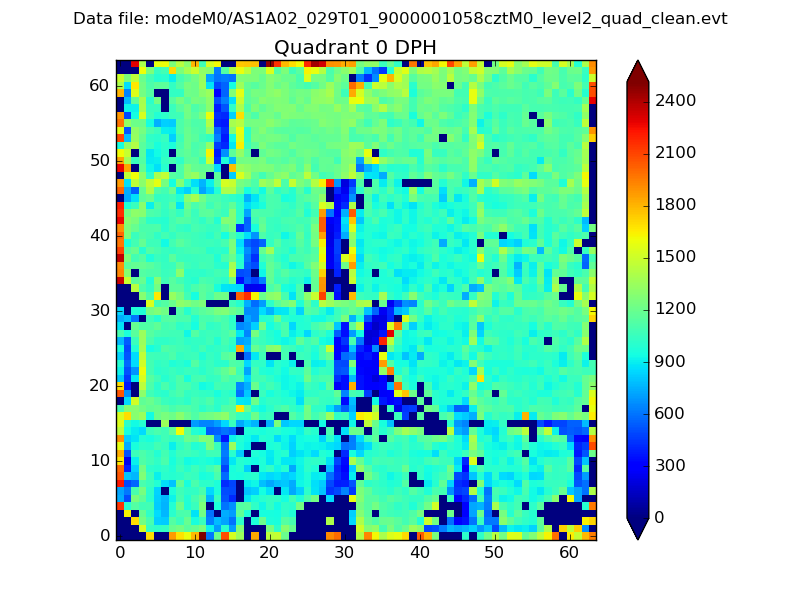 |
 |
Quadrant B |
|---|---|---|---|
| Quadrant D |  |
 |
Quadrant C |
| Plot type | Count rate plots | Images |
|---|---|---|
| Comparison with Poisson distribution Blue bars denote a histogram of data divided into 1 sec bins. Red curve is a Poisson curve with rate = median count rate of data. |
 |
 |
| Quadrant-wise count rates Data is divided into 100 sec bins |
 |
|
| Module-wise count rates for Quadrant A Data is divided into 100 sec bins |
 |
 |
| Module-wise count rates for Quadrant B Data is divided into 100 sec bins |
 |
 |
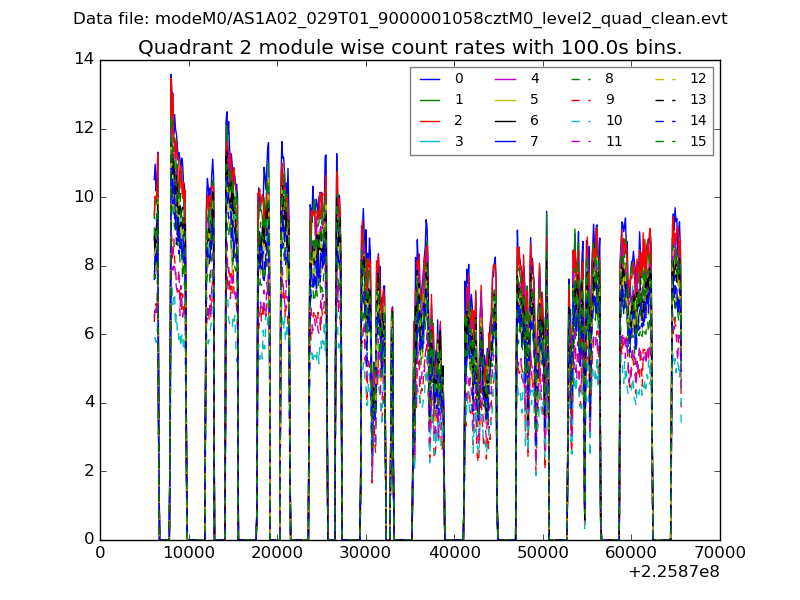
| Module-wise count rates for Quadrant C Data is divided into 100 sec bins |
 |
 |
| Module-wise count rates for Quadrant D Data is divided into 100 sec bins |
 |
 |
| Parameter | Plot |
|---|---|
| CZT HV Monitor | 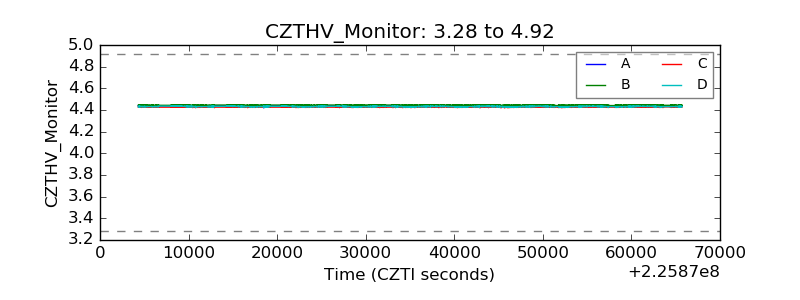 |
| D_VDD |  |
| Temperature 1 | 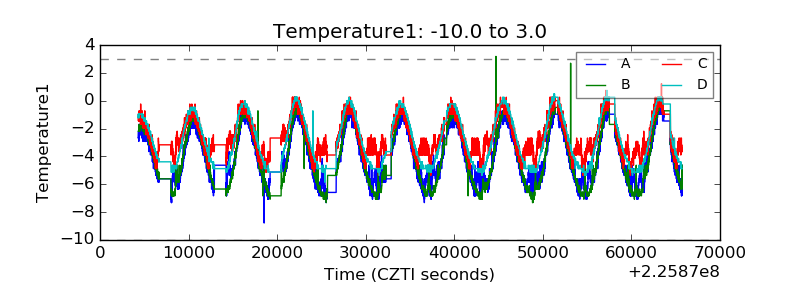 |
| Veto HV Monitor |  |
| Veto LLD |  |
| Alpha Counter |  |
| _CPM_Rate |  |
| CZT Counter |  |
| +2.5 Volts monitor |  |
| +5 Volts monitor | 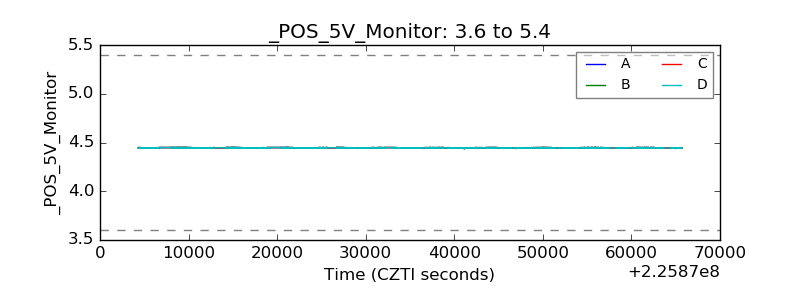 |
| _ROLL_ROT |  |
| _Roll_DEC |  |
| _Roll_RA | 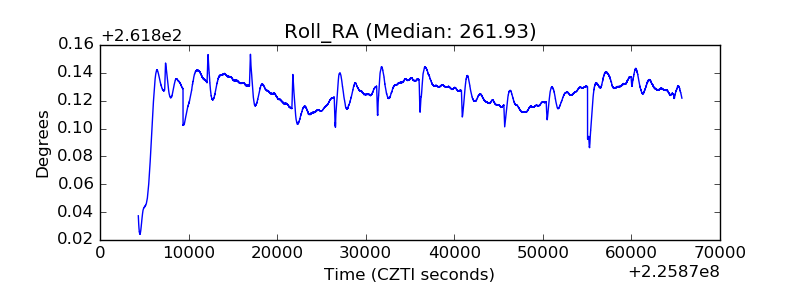 |
| Veto Counter |  |