| Param | Original file | Final file |
|---|---|---|
| Filename | modeM0/AS1G06_114T01_9000001056cztM0_level2.evt | modeM0/AS1G06_114T01_9000001056cztM0_level2_quad_clean.evt |
| Size (bytes) | 2,885,736,960 | 536,342,400 |
| Size | 2.7 GB | 511.5 MB |
| Events in quadrant A | 19,375,261 | 3,381,775 |
| Events in quadrant B | 20,775,022 | 3,411,657 |
| Events in quadrant C | 20,031,493 | 3,380,973 |
| Events in quadrant D | 24,393,989 | 3,204,774 |
| Mode M0 | |||
|---|---|---|---|
| Quadrant | BADHDUFLAG | Total packets | Discarded packets |
| A | 0 | 85636 | 0 |
| B | 0 | 89209 | 0 |
| C | 0 | 87378 | 0 |
| D | 0 | 100983 | 0 |
| Mode M9 | |||
|---|---|---|---|
| Quadrant | BADHDUFLAG | Total packets | Discarded packets |
| A | 0 | 55 | 0 |
| B | 0 | 55 | 0 |
| C | 0 | 55 | 0 |
| D | 0 | 55 | 0 |
| Mode SS | |||
|---|---|---|---|
| Quadrant | BADHDUFLAG | Total packets | Discarded packets |
| A | 0 | 854 | 0 |
| B | 0 | 854 | 0 |
| C | 0 | 854 | 0 |
| D | 0 | 854 | 0 |
| Quadrant | Total seconds | Saturated seconds | Saturation percentage |
|---|---|---|---|
| A | 41742 | 376 | 0.900771% |
| B | 41742 | 610 | 1.461358% |
| C | 41742 | 274 | 0.656413% |
| D | 41742 | 1385 | 3.318001% |
Noise dominated data is calculated using 1-second bins in cleaned event files. If a bin has >2000 counts, and if more than 50% of those come from <1% of pixels, then it is considered to be noise-dominated and hence unusable.
| Quadrant | # 1 sec bins | Bins with >0 counts | Bins with >2000 counts | High rate bins dominated by noise | Noise dominated (total time) | Noise dominated (detector-on time) | Marked lightcurve |
|---|---|---|---|---|---|---|---|
| A | 47422 | 41750 | 0 | 0 | 0.00% | 0.00% | 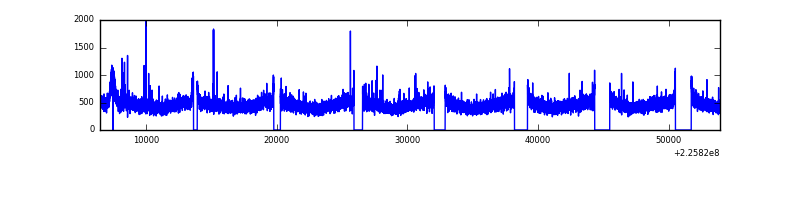 |
| B | 47422 | 41750 | 64 | 64 | 0.13% | 0.15% |  |
| C | 47422 | 41750 | 40 | 40 | 0.08% | 0.10% | 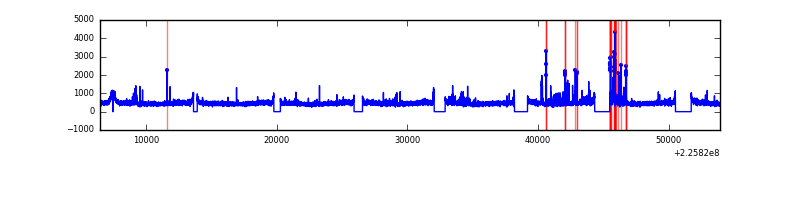 |
| D | 47422 | 41750 | 966 | 966 | 2.04% | 2.31% |  |
Top three noisy pixels from each quadrant. If the there are fewer than three noisy pixels in the level2.evt file, extra rows are filled as -1
| Pixel properties | Quadrant properties | ||||||
|---|---|---|---|---|---|---|---|
| Quadrant | DetID | PixID | Counts | Sigma | Mean | Median | Sigma |
| A | 0 | 226 | 47902 | 42.37 | 5007 | 4894 | 1015.0 |
| A | 12 | 194 | 44528 | 39.05 | 5007 | 4894 | 1015.0 |
| A | 15 | 174 | 29917 | 24.65 | 5007 | 4894 | 1015.0 |
| B | 10 | 245 | 283943 | 294.07 | 5025 | 4904 | 948.9 |
| B | 0 | 229 | 276884 | 286.63 | 5025 | 4904 | 948.9 |
| B | 4 | 239 | 213550 | 219.88 | 5025 | 4904 | 948.9 |
| C | 9 | 68 | 749777 | 656.09 | 4896 | 4934 | 1135.3 |
| C | 8 | 208 | 100809 | 84.45 | 4896 | 4934 | 1135.3 |
| C | 13 | 61 | 37902 | 29.04 | 4896 | 4934 | 1135.3 |
| D | 1 | 20 | 2039632 | 1710.83 | 4855 | 4711 | 1189.4 |
| D | 2 | 152 | 1499797 | 1256.97 | 4855 | 4711 | 1189.4 |
| D | 13 | 104 | 1441223 | 1207.73 | 4855 | 4711 | 1189.4 |
Histogram calculated using DETX and DETY for each event in the final _common_clean file
| Quadrant A | 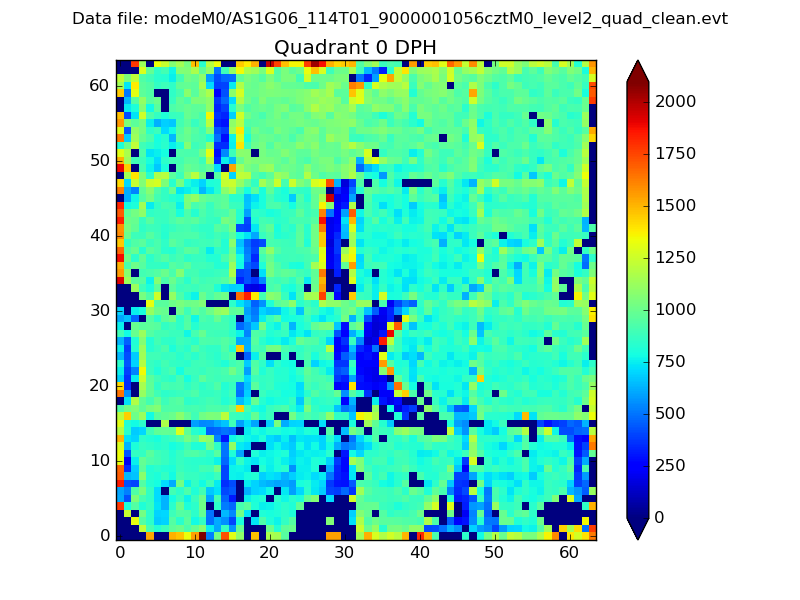 |
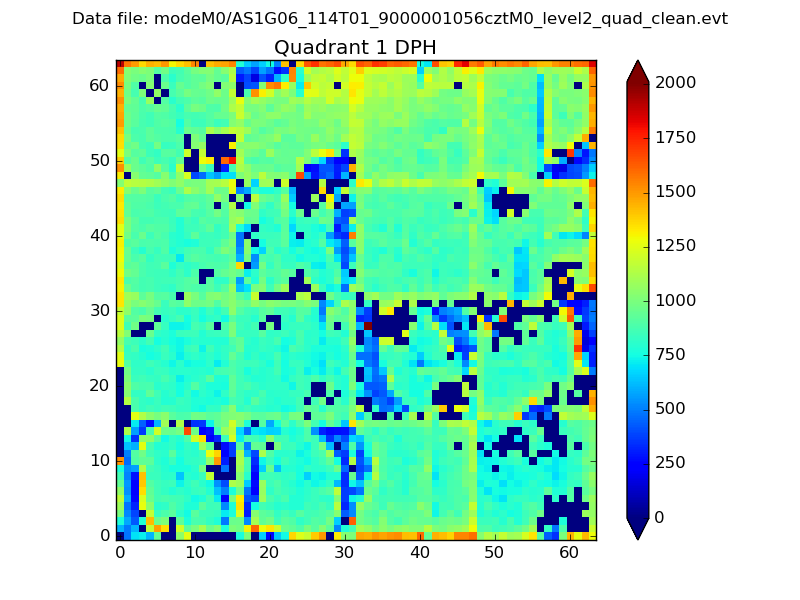 |
Quadrant B |
|---|---|---|---|
| Quadrant D | 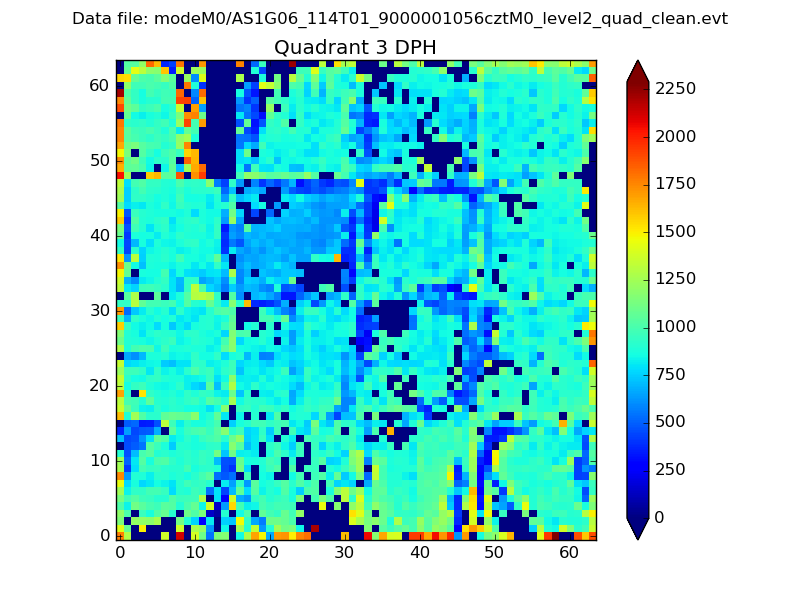 |
 |
Quadrant C |
| Plot type | Count rate plots | Images |
|---|---|---|
| Comparison with Poisson distribution Blue bars denote a histogram of data divided into 1 sec bins. Red curve is a Poisson curve with rate = median count rate of data. |
 |
 |
| Quadrant-wise count rates Data is divided into 100 sec bins |
 |
|
| Module-wise count rates for Quadrant A Data is divided into 100 sec bins |
 |
 |
| Module-wise count rates for Quadrant B Data is divided into 100 sec bins |
 |
 |
| Module-wise count rates for Quadrant C Data is divided into 100 sec bins |
 |
 |
| Module-wise count rates for Quadrant D Data is divided into 100 sec bins |
 |
 |
| Parameter | Plot |
|---|---|
| CZT HV Monitor |  |
| D_VDD |  |
| Temperature 1 |  |
| Veto HV Monitor |  |
| Veto LLD |  |
| Alpha Counter |  |
| _CPM_Rate |  |
| CZT Counter |  |
| +2.5 Volts monitor |  |
| +5 Volts monitor |  |
| _ROLL_ROT |  |
| _Roll_DEC |  |
| _Roll_RA | 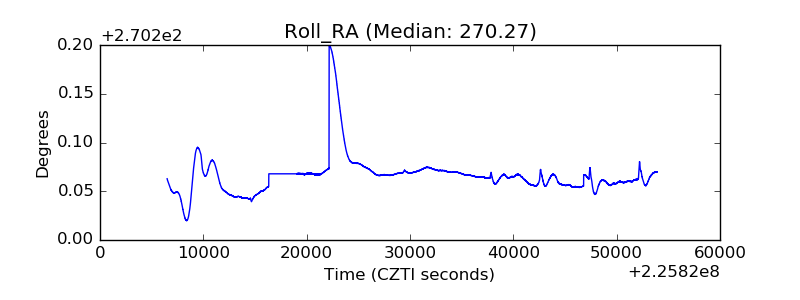 |
| Veto Counter |  |