| Param | Original file | Final file |
|---|---|---|
| Filename | modeM0/AS1G06_124T01_9000001054cztM0_level2.evt | modeM0/AS1G06_124T01_9000001054cztM0_level2_quad_clean.evt |
| Size (bytes) | 6,838,470,720 | 1,138,694,400 |
| Size | 6.4 GB | 1.1 GB |
| Events in quadrant A | 50,515,478 | 6,803,994 |
| Events in quadrant B | 46,690,547 | 7,187,243 |
| Events in quadrant C | 56,302,744 | 7,061,438 |
| Events in quadrant D | 47,100,364 | 6,835,213 |
| Mode M0 | |||
|---|---|---|---|
| Quadrant | BADHDUFLAG | Total packets | Discarded packets |
| A | 0 | 213994 | 0 |
| B | 0 | 201470 | 0 |
| C | 0 | 232156 | 0 |
| D | 0 | 207072 | 0 |
| Mode SS | |||
|---|---|---|---|
| Quadrant | BADHDUFLAG | Total packets | Discarded packets |
| A | 0 | 1962 | 0 |
| B | 0 | 1962 | 0 |
| C | 0 | 1962 | 0 |
| D | 0 | 1962 | 0 |
| Mode M9 | |||
|---|---|---|---|
| Quadrant | BADHDUFLAG | Total packets | Discarded packets |
| A | 0 | 151 | 0 |
| B | 0 | 151 | 0 |
| C | 0 | 151 | 0 |
| D | 0 | 151 | 0 |
| Quadrant | Total seconds | Saturated seconds | Saturation percentage |
|---|---|---|---|
| A | 96312 | 3674 | 3.814686% |
| B | 96312 | 1216 | 1.262563% |
| C | 96312 | 1555 | 1.614544% |
| D | 96312 | 1136 | 1.179500% |
Noise dominated data is calculated using 1-second bins in cleaned event files. If a bin has >2000 counts, and if more than 50% of those come from <1% of pixels, then it is considered to be noise-dominated and hence unusable.
| Quadrant | # 1 sec bins | Bins with >0 counts | Bins with >2000 counts | High rate bins dominated by noise | Noise dominated (total time) | Noise dominated (detector-on time) | Marked lightcurve |
|---|---|---|---|---|---|---|---|
| A | 110822 | 96328 | 2502 | 2502 | 2.26% | 2.60% |  |
| B | 110822 | 96331 | 50 | 50 | 0.05% | 0.05% |  |
| C | 110822 | 96331 | 604 | 604 | 0.55% | 0.63% |  |
| D | 110822 | 96330 | 348 | 348 | 0.31% | 0.36% |  |
Top three noisy pixels from each quadrant. If the there are fewer than three noisy pixels in the level2.evt file, extra rows are filled as -1
| Pixel properties | Quadrant properties | ||||||
|---|---|---|---|---|---|---|---|
| Quadrant | DetID | PixID | Counts | Sigma | Mean | Median | Sigma |
| A | 0 | 128 | 6248968 | 2715.71 | 11444 | 11190 | 2296.9 |
| A | 13 | 248 | 130410 | 51.9 | 11444 | 11190 | 2296.9 |
| A | 0 | 226 | 108363 | 42.31 | 11444 | 11190 | 2296.9 |
| B | 4 | 81 | 393734 | 171.43 | 11746 | 11462 | 2230.0 |
| B | 0 | 214 | 284738 | 122.55 | 11746 | 11462 | 2230.0 |
| B | 12 | 111 | 237057 | 101.17 | 11746 | 11462 | 2230.0 |
| C | 9 | 68 | 11373165 | 4324.33 | 11397 | 11462 | 2627.4 |
| C | 1 | 16 | 339432 | 124.83 | 11397 | 11462 | 2627.4 |
| C | 13 | 61 | 87104 | 28.79 | 11397 | 11462 | 2627.4 |
| D | 13 | 104 | 937474 | 335.02 | 11414 | 11083 | 2765.2 |
| D | 2 | 14 | 868098 | 309.93 | 11414 | 11083 | 2765.2 |
| D | 2 | 152 | 840198 | 299.84 | 11414 | 11083 | 2765.2 |
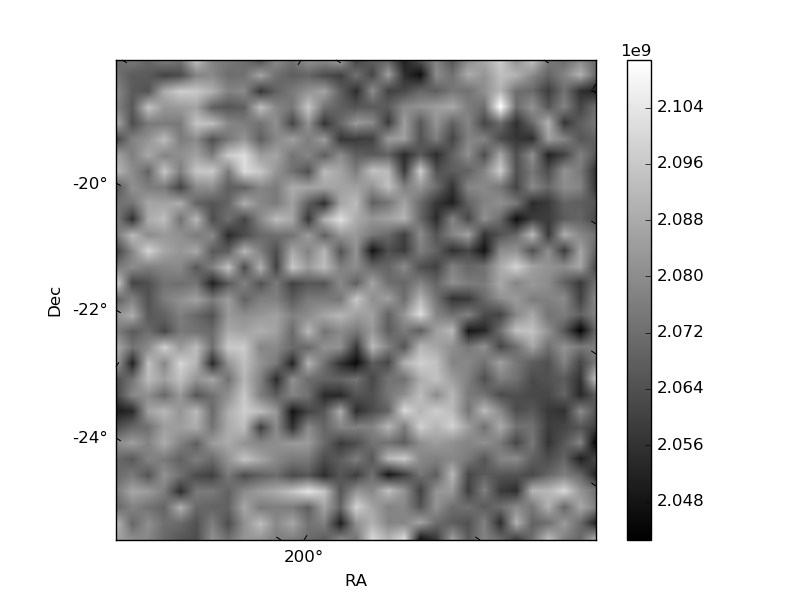
Histogram calculated using DETX and DETY for each event in the final _common_clean file
| Quadrant A |  |
 |
Quadrant B |
|---|---|---|---|
| Quadrant D |  |
 |
Quadrant C |
| Plot type | Count rate plots | Images |
|---|---|---|
| Comparison with Poisson distribution Blue bars denote a histogram of data divided into 1 sec bins. Red curve is a Poisson curve with rate = median count rate of data. |
 |
 |
| Quadrant-wise count rates Data is divided into 100 sec bins |
 |
|
| Module-wise count rates for Quadrant A Data is divided into 100 sec bins |
 |
 |
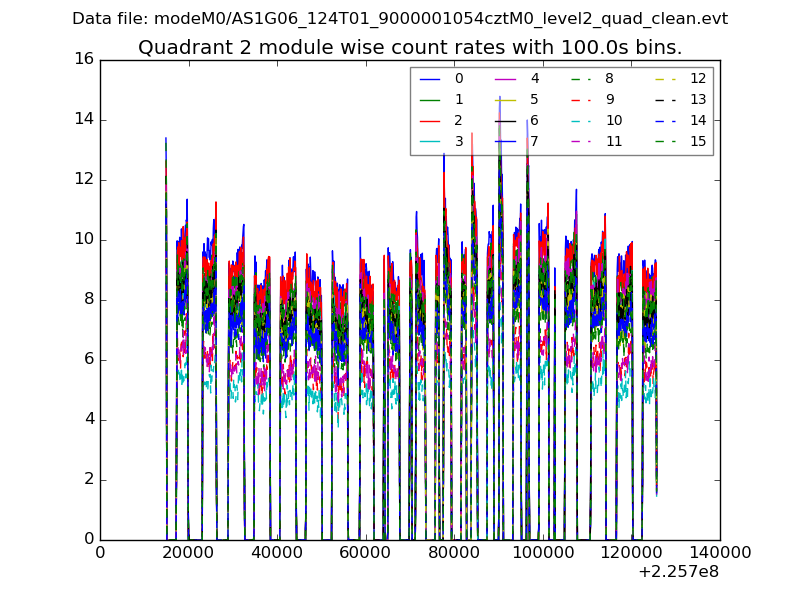
| Module-wise count rates for Quadrant B Data is divided into 100 sec bins |
 |
 |
| Module-wise count rates for Quadrant C Data is divided into 100 sec bins |
 |
 |
| Module-wise count rates for Quadrant D Data is divided into 100 sec bins |
 |
 |
| Parameter | Plot |
|---|---|
| CZT HV Monitor |  |
| D_VDD |  |
| Temperature 1 |  |
| Veto HV Monitor |  |
| Veto LLD |  |
| Alpha Counter |  |
| _CPM_Rate |  |
| CZT Counter |  |
| +2.5 Volts monitor | 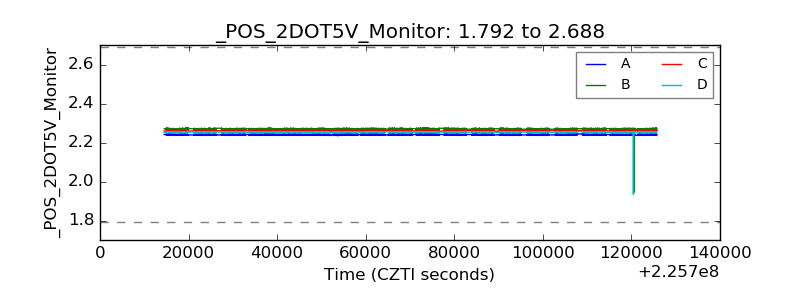 |
| +5 Volts monitor |  |
| _ROLL_ROT |  |
| _Roll_DEC | 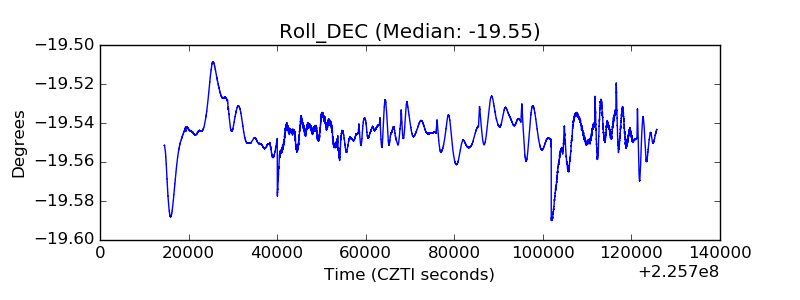 |
| _Roll_RA |  |
| Veto Counter |  |