| Param | Original file | Final file |
|---|---|---|
| Filename | modeM0/AS1T01_157T01_9000001050cztM0_level2.evt | modeM0/AS1T01_157T01_9000001050cztM0_level2_quad_clean.evt |
| Size (bytes) | 1,587,931,200 | 163,301,760 |
| Size | 1.5 GB | 155.7 MB |
| Events in quadrant A | 7,853,838 | 1,035,511 |
| Events in quadrant B | 7,055,381 | 1,047,473 |
| Events in quadrant C | 23,916,226 | 906,013 |
| Events in quadrant D | 8,310,265 | 975,268 |
| Mode M9 | |||
|---|---|---|---|
| Quadrant | BADHDUFLAG | Total packets | Discarded packets |
| A | 0 | 23 | 0 |
| B | 0 | 23 | 0 |
| C | 0 | 23 | 0 |
| D | 0 | 23 | 0 |
| Mode M0 | |||
|---|---|---|---|
| Quadrant | BADHDUFLAG | Total packets | Discarded packets |
| A | 0 | 32477 | 0 |
| B | 0 | 30067 | 0 |
| C | 0 | 80886 | 0 |
| D | 0 | 34240 | 0 |
| Mode SS | |||
|---|---|---|---|
| Quadrant | BADHDUFLAG | Total packets | Discarded packets |
| A | 0 | 288 | 0 |
| B | 0 | 288 | 0 |
| C | 0 | 288 | 0 |
| D | 0 | 288 | 0 |
| Quadrant | Total seconds | Saturated seconds | Saturation percentage |
|---|---|---|---|
| A | 14198 | 347 | 2.444006% |
| B | 14198 | 287 | 2.021411% |
| C | 14198 | 5277 | 37.167207% |
| D | 14198 | 512 | 3.606142% |
Noise dominated data is calculated using 1-second bins in cleaned event files. If a bin has >2000 counts, and if more than 50% of those come from <1% of pixels, then it is considered to be noise-dominated and hence unusable.
| Quadrant | # 1 sec bins | Bins with >0 counts | Bins with >2000 counts | High rate bins dominated by noise | Noise dominated (total time) | Noise dominated (detector-on time) | Marked lightcurve |
|---|---|---|---|---|---|---|---|
| A | 15418 | 14200 | 22 | 22 | 0.14% | 0.15% |  |
| B | 15418 | 14200 | 5 | 5 | 0.03% | 0.04% | 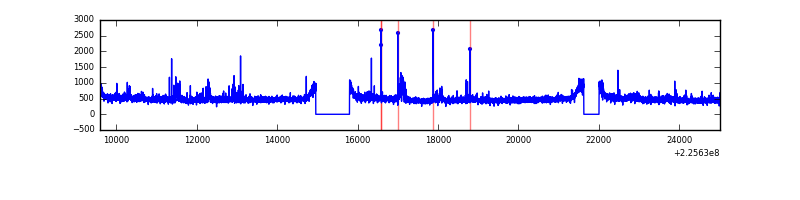 |
| C | 15418 | 14200 | 4633 | 4633 | 30.05% | 32.63% | 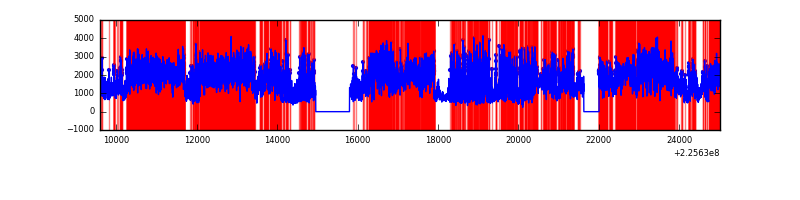 |
| D | 15418 | 14200 | 301 | 301 | 1.95% | 2.12% |  |
Top three noisy pixels from each quadrant. If the there are fewer than three noisy pixels in the level2.evt file, extra rows are filled as -1
| Pixel properties | Quadrant properties | ||||||
|---|---|---|---|---|---|---|---|
| Quadrant | DetID | PixID | Counts | Sigma | Mean | Median | Sigma |
| A | 13 | 251 | 1161353 | 3358.26 | 1707 | 1669 | 345.3 |
| A | 15 | 234 | 76027 | 215.33 | 1707 | 1669 | 345.3 |
| A | 3 | 1 | 32322 | 88.76 | 1707 | 1669 | 345.3 |
| B | 0 | 219 | 110184 | 330.89 | 1720 | 1679 | 327.9 |
| B | 0 | 229 | 101644 | 304.85 | 1720 | 1679 | 327.9 |
| B | 0 | 214 | 54100 | 159.86 | 1720 | 1679 | 327.9 |
| C | 9 | 68 | 11888725 | 34337.27 | 1497 | 1506 | 346.2 |
| C | 9 | 243 | 3802220 | 10978.69 | 1497 | 1506 | 346.2 |
| C | 4 | 254 | 2108006 | 6084.81 | 1497 | 1506 | 346.2 |
| D | 12 | 233 | 537904 | 1325.6 | 1651 | 1603 | 404.6 |
| D | 13 | 104 | 326022 | 801.88 | 1651 | 1603 | 404.6 |
| D | 2 | 152 | 288777 | 709.82 | 1651 | 1603 | 404.6 |
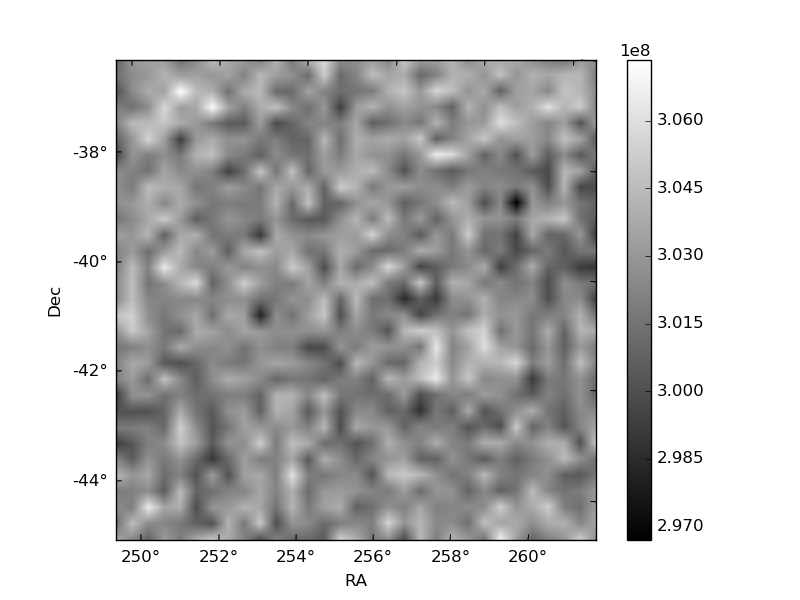
Histogram calculated using DETX and DETY for each event in the final _common_clean file
| Quadrant A | 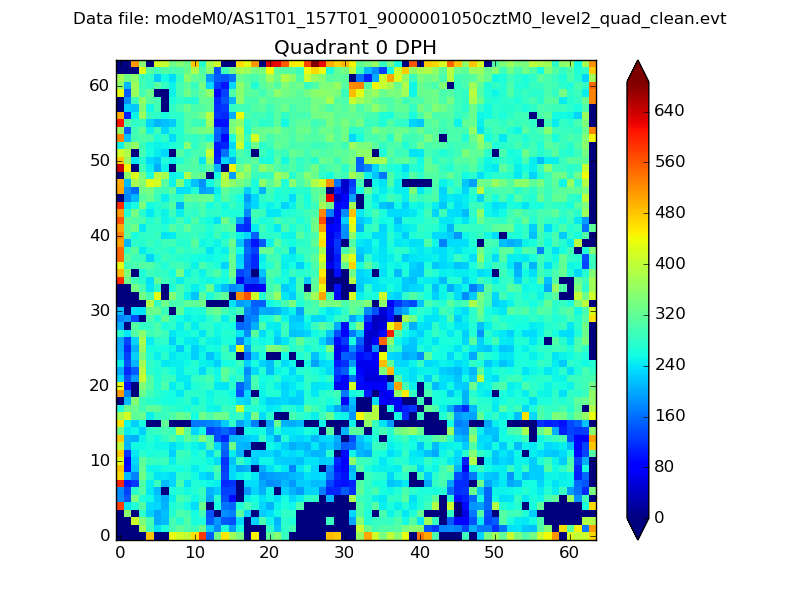 |
 |
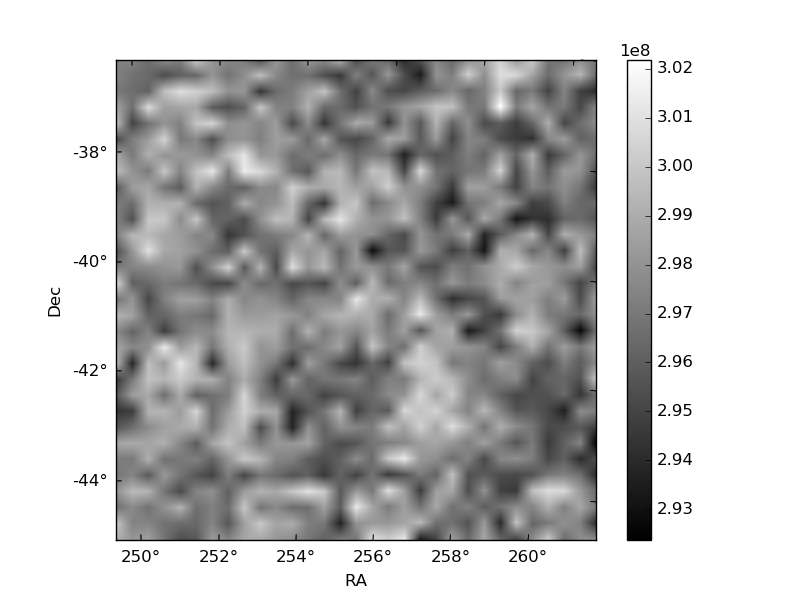
Quadrant B |
|---|---|---|---|
| Quadrant D |  |
 |
Quadrant C |
| Plot type | Count rate plots | Images |
|---|---|---|
| Comparison with Poisson distribution Blue bars denote a histogram of data divided into 1 sec bins. Red curve is a Poisson curve with rate = median count rate of data. |
 |
 |
| Quadrant-wise count rates Data is divided into 100 sec bins |
 |
|
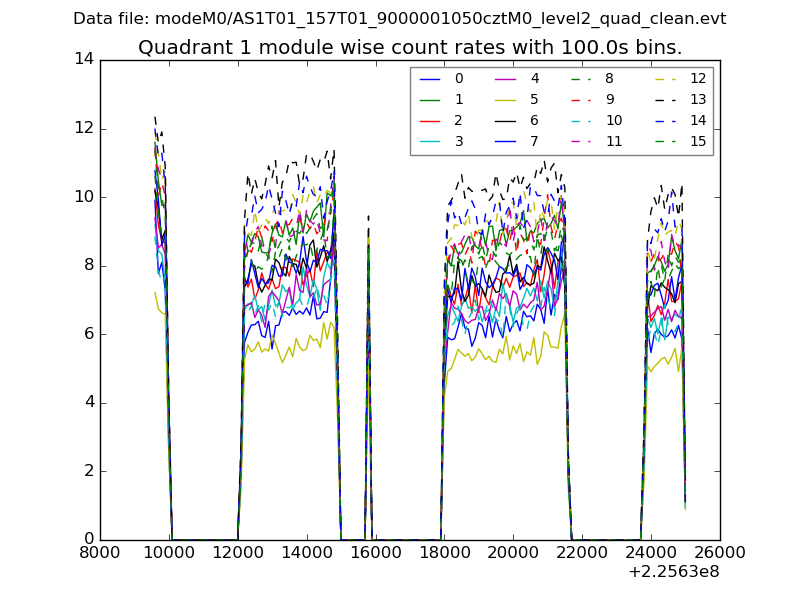
| Module-wise count rates for Quadrant A Data is divided into 100 sec bins |
 |
 |
| Module-wise count rates for Quadrant B Data is divided into 100 sec bins |
 |
 |
| Module-wise count rates for Quadrant C Data is divided into 100 sec bins |
 |
 |
| Module-wise count rates for Quadrant D Data is divided into 100 sec bins |
 |
 |
| Parameter | Plot |
|---|---|
| CZT HV Monitor | 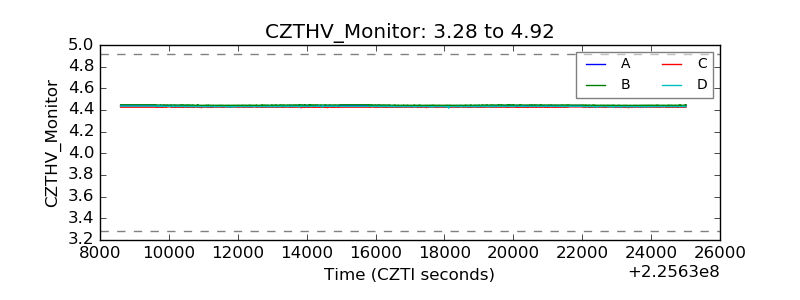 |
| D_VDD |  |
| Temperature 1 |  |
| Veto HV Monitor | 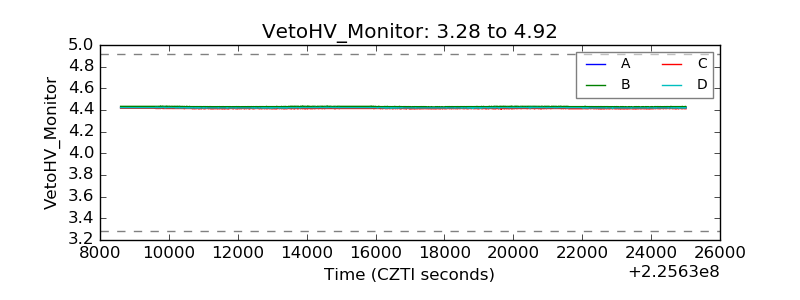 |
| Veto LLD |  |
| Alpha Counter | 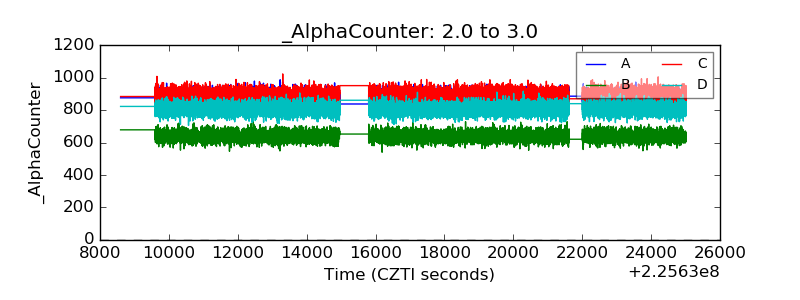 |
| _CPM_Rate |  |
| CZT Counter |  |
| +2.5 Volts monitor |  |
| +5 Volts monitor |  |
| _ROLL_ROT | 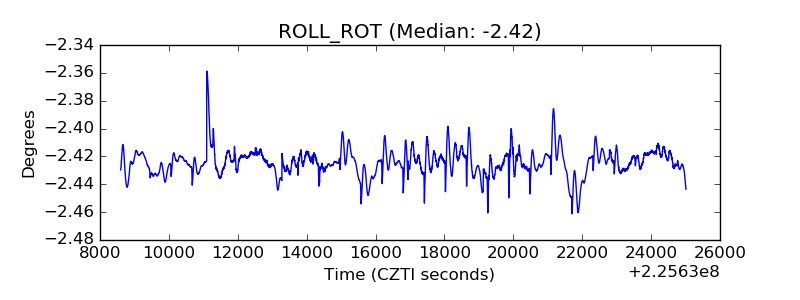 |
| _Roll_DEC |  |
| _Roll_RA |  |
| Veto Counter |  |