| Param | Original file | Final file |
|---|---|---|
| Filename | modeM0/AS1A02_178T01_9000001048cztM0_level2.evt | modeM0/AS1A02_178T01_9000001048cztM0_level2_quad_clean.evt |
| Size (bytes) | 6,500,424,960 | 958,227,840 |
| Size | 6.1 GB | 913.8 MB |
| Events in quadrant A | 43,654,621 | 5,935,478 |
| Events in quadrant B | 41,116,867 | 6,026,846 |
| Events in quadrant C | 61,393,292 | 5,765,110 |
| Events in quadrant D | 45,149,728 | 5,641,903 |
| Mode M9 | |||
|---|---|---|---|
| Quadrant | BADHDUFLAG | Total packets | Discarded packets |
| A | 0 | 144 | 0 |
| B | 0 | 144 | 0 |
| C | 0 | 144 | 0 |
| D | 0 | 144 | 0 |
| Mode SS | |||
|---|---|---|---|
| Quadrant | BADHDUFLAG | Total packets | Discarded packets |
| A | 0 | 1684 | 0 |
| B | 0 | 1684 | 0 |
| C | 0 | 1684 | 0 |
| D | 0 | 1684 | 0 |
| Mode M0 | |||
|---|---|---|---|
| Quadrant | BADHDUFLAG | Total packets | Discarded packets |
| A | 0 | 183799 | 0 |
| B | 0 | 175120 | 0 |
| C | 0 | 236997 | 0 |
| D | 0 | 190310 | 0 |
| Quadrant | Total seconds | Saturated seconds | Saturation percentage |
|---|---|---|---|
| A | 82450 | 1197 | 1.451789% |
| B | 82451 | 1271 | 1.541522% |
| C | 82447 | 4338 | 5.261562% |
| D | 82450 | 1647 | 1.997574% |
Noise dominated data is calculated using 1-second bins in cleaned event files. If a bin has >2000 counts, and if more than 50% of those come from <1% of pixels, then it is considered to be noise-dominated and hence unusable.
| Quadrant | # 1 sec bins | Bins with >0 counts | Bins with >2000 counts | High rate bins dominated by noise | Noise dominated (total time) | Noise dominated (detector-on time) | Marked lightcurve |
|---|---|---|---|---|---|---|---|
| A | 100328 | 82467 | 97 | 97 | 0.10% | 0.12% |  |
| B | 100328 | 82469 | 122 | 122 | 0.12% | 0.15% |  |
| C | 100328 | 82469 | 2888 | 2888 | 2.88% | 3.50% | 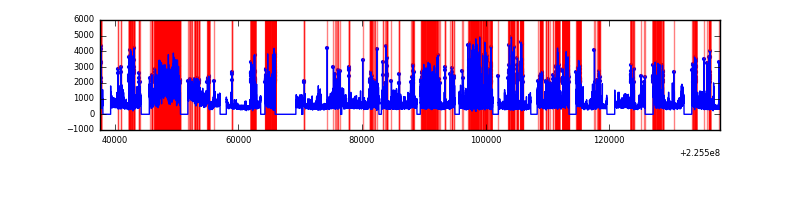 |
| D | 100328 | 82467 | 697 | 697 | 0.69% | 0.85% |  |
Top three noisy pixels from each quadrant. If the there are fewer than three noisy pixels in the level2.evt file, extra rows are filled as -1
| Pixel properties | Quadrant properties | ||||||
|---|---|---|---|---|---|---|---|
| Quadrant | DetID | PixID | Counts | Sigma | Mean | Median | Sigma |
| A | 13 | 251 | 4597351 | 2257.19 | 10113 | 9901 | 2032.4 |
| A | 0 | 226 | 96370 | 42.55 | 10113 | 9901 | 2032.4 |
| A | 12 | 194 | 88733 | 38.79 | 10113 | 9901 | 2032.4 |
| B | 0 | 214 | 419441 | 216.46 | 10142 | 9913 | 1891.9 |
| B | 4 | 239 | 295793 | 151.11 | 10142 | 9913 | 1891.9 |
| B | 4 | 81 | 292449 | 149.34 | 10142 | 9913 | 1891.9 |
| C | 9 | 68 | 19130467 | 8602.64 | 9706 | 9772 | 2222.7 |
| C | 4 | 254 | 3722576 | 1670.44 | 9706 | 9772 | 2222.7 |
| C | 1 | 16 | 459351 | 202.27 | 9706 | 9772 | 2222.7 |
| D | 13 | 104 | 2252595 | 931.79 | 9833 | 9549 | 2407.3 |
| D | 2 | 152 | 2244248 | 928.32 | 9833 | 9549 | 2407.3 |
| D | 2 | 14 | 2130223 | 880.95 | 9833 | 9549 | 2407.3 |
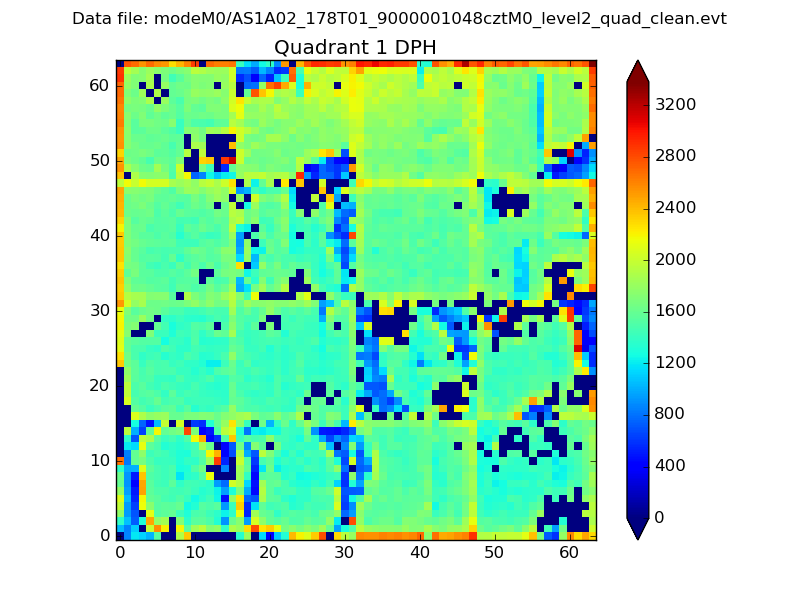
Histogram calculated using DETX and DETY for each event in the final _common_clean file
| Quadrant A |  |
 |
Quadrant B |
|---|---|---|---|
| Quadrant D | 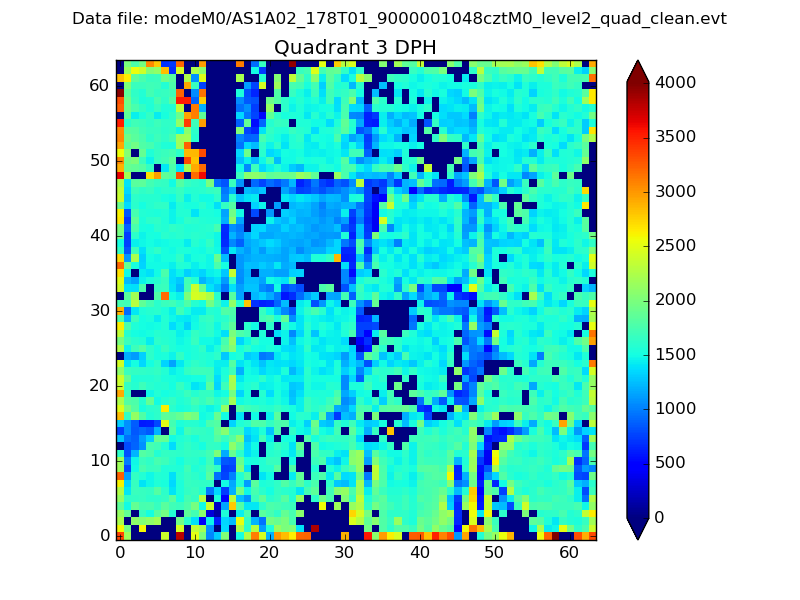 |
 |
Quadrant C |
| Plot type | Count rate plots | Images |
|---|---|---|
| Comparison with Poisson distribution Blue bars denote a histogram of data divided into 1 sec bins. Red curve is a Poisson curve with rate = median count rate of data. |
 |
 |
| Quadrant-wise count rates Data is divided into 100 sec bins |
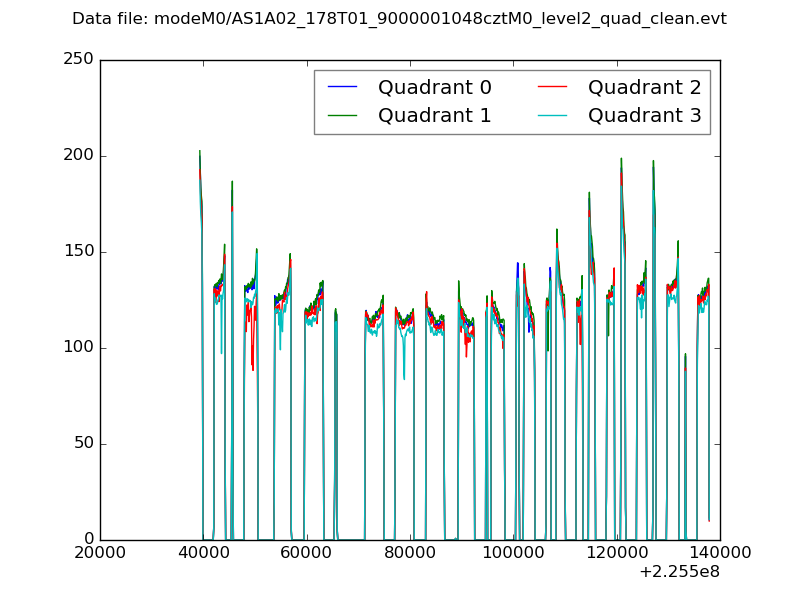 |
|
| Module-wise count rates for Quadrant A Data is divided into 100 sec bins |
 |
 |
| Module-wise count rates for Quadrant B Data is divided into 100 sec bins |
 |
 |
| Module-wise count rates for Quadrant C Data is divided into 100 sec bins |
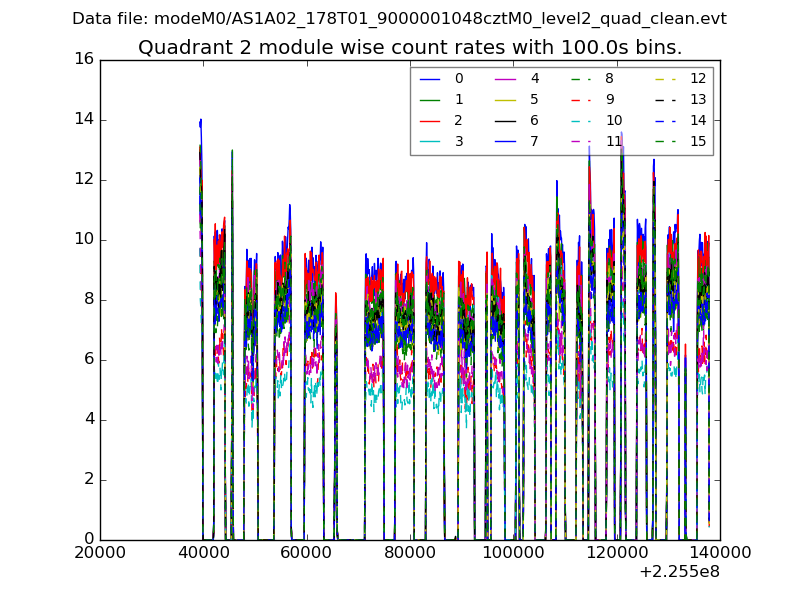 |
 |
| Module-wise count rates for Quadrant D Data is divided into 100 sec bins |
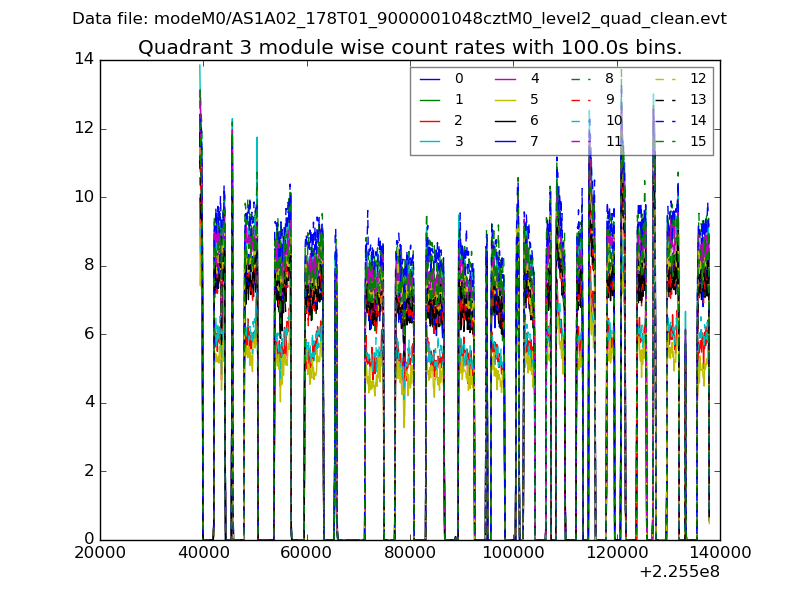 |
 |
| Parameter | Plot |
|---|---|
| CZT HV Monitor |  |
| D_VDD |  |
| Temperature 1 |  |
| Veto HV Monitor | 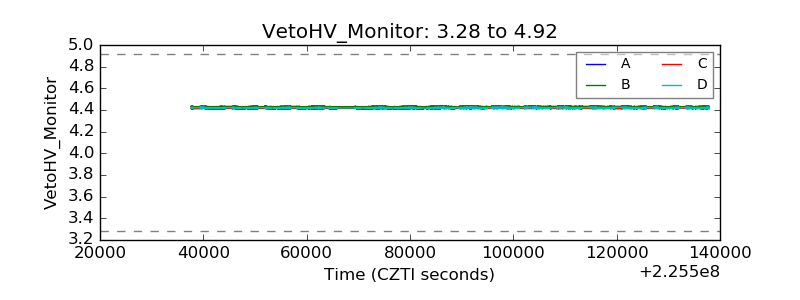 |
| Veto LLD |  |
| Alpha Counter | 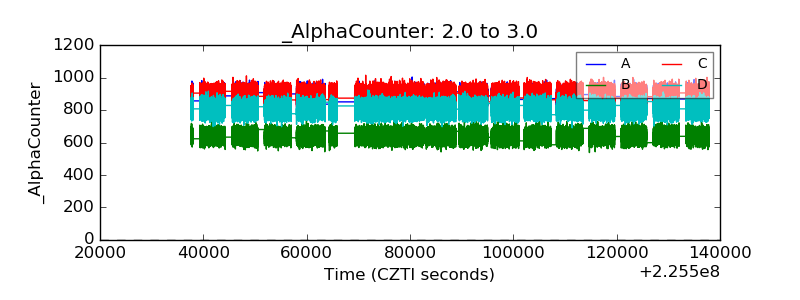 |
| _CPM_Rate |  |
| CZT Counter |  |
| +2.5 Volts monitor |  |
| +5 Volts monitor | 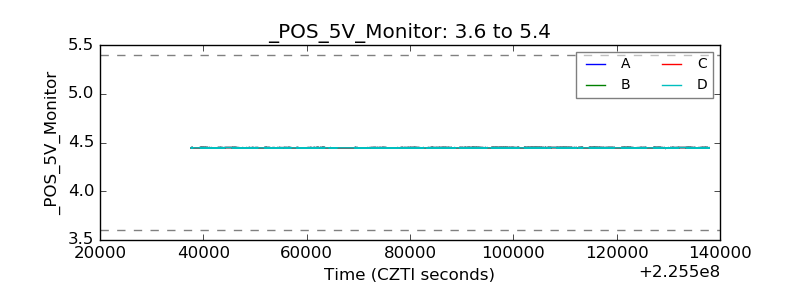 |
| _ROLL_ROT |  |
| _Roll_DEC | 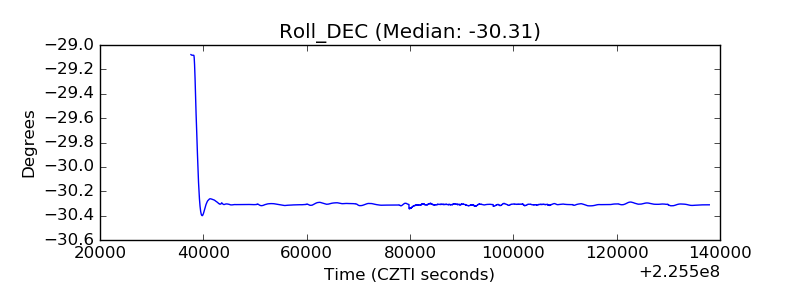 |
| _Roll_RA |  |
| Veto Counter |  |