| Param | Original file | Final file |
|---|---|---|
| Filename | modeM0/AS1T01_155T01_9000001042cztM0_level2.evt | modeM0/AS1T01_155T01_9000001042cztM0_level2_quad_clean.evt |
| Size (bytes) | 494,271,360 | 110,520,000 |
| Size | 471.4 MB | 105.4 MB |
| Events in quadrant A | 3,266,025 | 747,485 |
| Events in quadrant B | 3,293,091 | 749,495 |
| Events in quadrant C | 4,421,415 | 714,096 |
| Events in quadrant D | 3,561,649 | 697,490 |
| Mode M0 | |||
|---|---|---|---|
| Quadrant | BADHDUFLAG | Total packets | Discarded packets |
| A | 0 | 13626 | 0 |
| B | 0 | 13722 | 0 |
| C | 0 | 17202 | 0 |
| D | 0 | 14587 | 0 |
| Mode SS | |||
|---|---|---|---|
| Quadrant | BADHDUFLAG | Total packets | Discarded packets |
| A | 0 | 130 | 0 |
| B | 0 | 130 | 0 |
| C | 0 | 130 | 0 |
| D | 0 | 130 | 0 |
| Mode M9 | |||
|---|---|---|---|
| Quadrant | BADHDUFLAG | Total packets | Discarded packets |
| A | 0 | 25 | 0 |
| B | 0 | 25 | 0 |
| C | 0 | 25 | 0 |
| D | 0 | 25 | 0 |
| Quadrant | Total seconds | Saturated seconds | Saturation percentage |
|---|---|---|---|
| A | 6286 | 147 | 2.338530% |
| B | 6286 | 132 | 2.099905% |
| C | 6286 | 269 | 4.279351% |
| D | 6286 | 155 | 2.465797% |
Noise dominated data is calculated using 1-second bins in cleaned event files. If a bin has >2000 counts, and if more than 50% of those come from <1% of pixels, then it is considered to be noise-dominated and hence unusable.
| Quadrant | # 1 sec bins | Bins with >0 counts | Bins with >2000 counts | High rate bins dominated by noise | Noise dominated (total time) | Noise dominated (detector-on time) | Marked lightcurve |
|---|---|---|---|---|---|---|---|
| A | 8726 | 6286 | 2 | 2 | 0.02% | 0.03% | 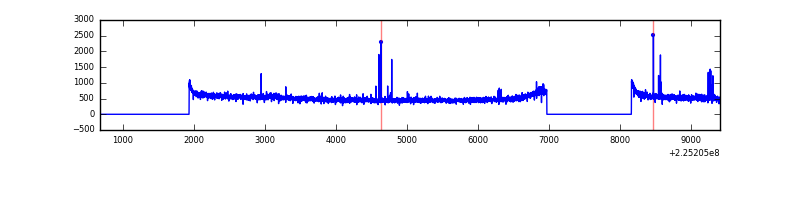 |
| B | 8726 | 6287 | 1 | 1 | 0.01% | 0.02% |  |
| C | 8726 | 6286 | 133 | 133 | 1.52% | 2.12% |  |
| D | 8726 | 6286 | 30 | 30 | 0.34% | 0.48% |  |
Top three noisy pixels from each quadrant. If the there are fewer than three noisy pixels in the level2.evt file, extra rows are filled as -1
| Pixel properties | Quadrant properties | ||||||
|---|---|---|---|---|---|---|---|
| Quadrant | DetID | PixID | Counts | Sigma | Mean | Median | Sigma |
| A | 3 | 1 | 37348 | 215.07 | 833 | 818 | 169.9 |
| A | 1 | 162 | 9912 | 53.54 | 833 | 818 | 169.9 |
| A | 0 | 226 | 7849 | 41.39 | 833 | 818 | 169.9 |
| B | 0 | 214 | 29730 | 182.42 | 830 | 813 | 158.5 |
| B | 0 | 230 | 19999 | 121.03 | 830 | 813 | 158.5 |
| B | 0 | 219 | 18622 | 112.35 | 830 | 813 | 158.5 |
| C | 9 | 68 | 1316383 | 7157.5 | 791 | 798 | 183.8 |
| C | 10 | 22 | 10924 | 55.09 | 791 | 798 | 183.8 |
| C | 13 | 61 | 6053 | 28.59 | 791 | 798 | 183.8 |
| D | 2 | 152 | 223814 | 1111.08 | 807 | 784 | 200.7 |
| D | 2 | 244 | 133212 | 659.73 | 807 | 784 | 200.7 |
| D | 2 | 14 | 81370 | 401.46 | 807 | 784 | 200.7 |
Histogram calculated using DETX and DETY for each event in the final _common_clean file
| Quadrant A |  |
 |
Quadrant B |
|---|---|---|---|
| Quadrant D |  |
 |
Quadrant C |
| Plot type | Count rate plots | Images |
|---|---|---|
| Comparison with Poisson distribution Blue bars denote a histogram of data divided into 1 sec bins. Red curve is a Poisson curve with rate = median count rate of data. |
 |
 |
| Quadrant-wise count rates Data is divided into 100 sec bins |
 |
|
| Module-wise count rates for Quadrant A Data is divided into 100 sec bins |
 |
 |
| Module-wise count rates for Quadrant B Data is divided into 100 sec bins |
 |
 |
| Module-wise count rates for Quadrant C Data is divided into 100 sec bins |
 |
 |
| Module-wise count rates for Quadrant D Data is divided into 100 sec bins |
 |
 |
| Parameter | Plot |
|---|---|
| CZT HV Monitor |  |
| D_VDD |  |
| Temperature 1 | 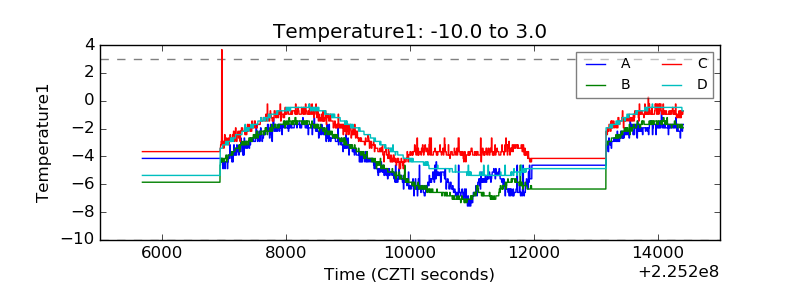 |
| Veto HV Monitor | 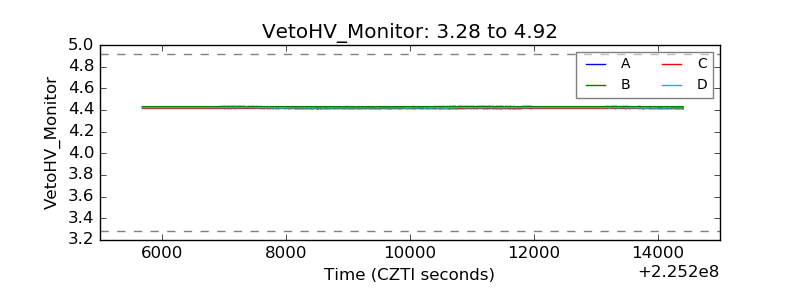 |
| Veto LLD |  |
| Alpha Counter |  |
| _CPM_Rate |  |
| CZT Counter |  |
| +2.5 Volts monitor |  |
| +5 Volts monitor |  |
| _ROLL_ROT |  |
| _Roll_DEC |  |
| _Roll_RA |  |
| Veto Counter | 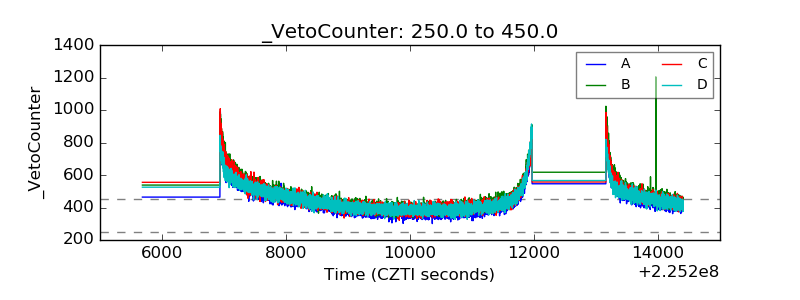 |