| Param | Original file | Final file |
|---|---|---|
| Filename | modeM0/AS1G06_164T01_9000001040cztM0_level2.evt | modeM0/AS1G06_164T01_9000001040cztM0_level2_quad_clean.evt |
| Size (bytes) | 2,540,672,640 | 544,507,200 |
| Size | 2.4 GB | 519.3 MB |
| Events in quadrant A | 17,717,598 | 3,502,091 |
| Events in quadrant B | 18,020,327 | 3,577,399 |
| Events in quadrant C | 18,172,359 | 3,464,442 |
| Events in quadrant D | 20,438,899 | 3,310,792 |
| Mode SS | |||
|---|---|---|---|
| Quadrant | BADHDUFLAG | Total packets | Discarded packets |
| A | 0 | 780 | 0 |
| B | 0 | 780 | 0 |
| C | 0 | 780 | 0 |
| D | 0 | 780 | 0 |
| Mode M0 | |||
|---|---|---|---|
| Quadrant | BADHDUFLAG | Total packets | Discarded packets |
| A | 0 | 78690 | 0 |
| B | 0 | 79019 | 0 |
| C | 0 | 80346 | 0 |
| D | 0 | 87485 | 0 |
| Mode M9 | |||
|---|---|---|---|
| Quadrant | BADHDUFLAG | Total packets | Discarded packets |
| A | 0 | 65 | 0 |
| B | 0 | 65 | 0 |
| C | 0 | 65 | 0 |
| D | 0 | 65 | 0 |
| Quadrant | Total seconds | Saturated seconds | Saturation percentage |
|---|---|---|---|
| A | 38428 | 314 | 0.817113% |
| B | 38428 | 336 | 0.874362% |
| C | 38428 | 385 | 1.001874% |
| D | 38428 | 765 | 1.990736% |
Noise dominated data is calculated using 1-second bins in cleaned event files. If a bin has >2000 counts, and if more than 50% of those come from <1% of pixels, then it is considered to be noise-dominated and hence unusable.
| Quadrant | # 1 sec bins | Bins with >0 counts | Bins with >2000 counts | High rate bins dominated by noise | Noise dominated (total time) | Noise dominated (detector-on time) | Marked lightcurve |
|---|---|---|---|---|---|---|---|
| A | 44838 | 38431 | 8 | 8 | 0.02% | 0.02% |  |
| B | 44838 | 38430 | 8 | 8 | 0.02% | 0.02% |  |
| C | 44838 | 38431 | 173 | 173 | 0.39% | 0.45% |  |
| D | 44838 | 38431 | 460 | 460 | 1.03% | 1.20% |  |
Top three noisy pixels from each quadrant. If the there are fewer than three noisy pixels in the level2.evt file, extra rows are filled as -1
| Pixel properties | Quadrant properties | ||||||
|---|---|---|---|---|---|---|---|
| Quadrant | DetID | PixID | Counts | Sigma | Mean | Median | Sigma |
| A | 15 | 239 | 85230 | 88.52 | 4553 | 4454 | 912.5 |
| A | 14 | 111 | 48797 | 48.59 | 4553 | 4454 | 912.5 |
| A | 0 | 226 | 43190 | 42.45 | 4553 | 4454 | 912.5 |
| B | 0 | 214 | 102337 | 114.97 | 4577 | 4463 | 851.3 |
| B | 12 | 111 | 86780 | 96.7 | 4577 | 4463 | 851.3 |
| B | 0 | 219 | 77847 | 86.2 | 4577 | 4463 | 851.3 |
| C | 1 | 16 | 562672 | 550.54 | 4415 | 4434 | 1014.0 |
| C | 9 | 68 | 290978 | 282.59 | 4415 | 4434 | 1014.0 |
| C | 8 | 229 | 73518 | 68.13 | 4415 | 4434 | 1014.0 |
| D | 2 | 152 | 2027447 | 1901.69 | 4407 | 4274 | 1063.9 |
| D | 2 | 14 | 819089 | 765.89 | 4407 | 4274 | 1063.9 |
| D | 13 | 169 | 199766 | 183.75 | 4407 | 4274 | 1063.9 |
Histogram calculated using DETX and DETY for each event in the final _common_clean file
| Quadrant A |  |
 |
Quadrant B |
|---|---|---|---|
| Quadrant D | 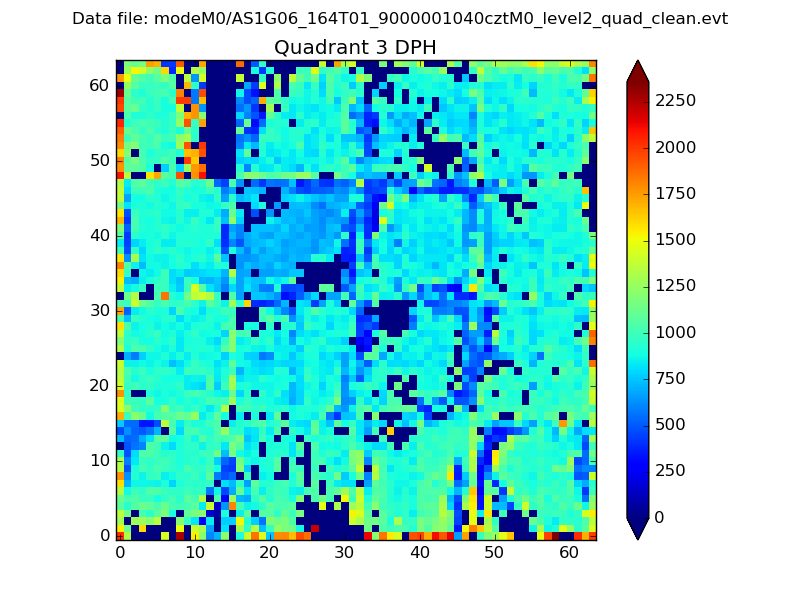 |
 |
Quadrant C |
| Plot type | Count rate plots | Images |
|---|---|---|
| Comparison with Poisson distribution Blue bars denote a histogram of data divided into 1 sec bins. Red curve is a Poisson curve with rate = median count rate of data. |
 |
 |
| Quadrant-wise count rates Data is divided into 100 sec bins |
 |
|
| Module-wise count rates for Quadrant A Data is divided into 100 sec bins |
 |
 |
| Module-wise count rates for Quadrant B Data is divided into 100 sec bins |
 |
 |
| Module-wise count rates for Quadrant C Data is divided into 100 sec bins |
 |
 |
| Module-wise count rates for Quadrant D Data is divided into 100 sec bins |
 |
 |
| Parameter | Plot |
|---|---|
| CZT HV Monitor | 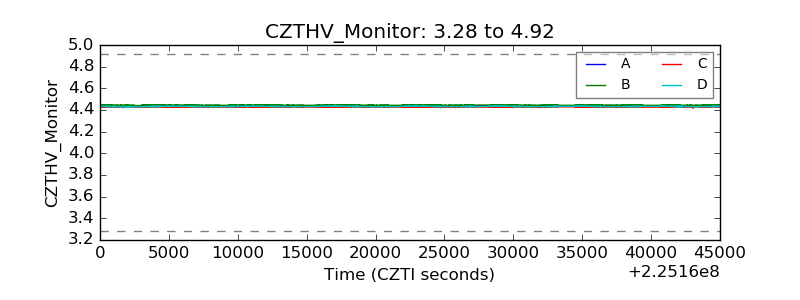 |
| D_VDD |  |
| Temperature 1 |  |
| Veto HV Monitor | 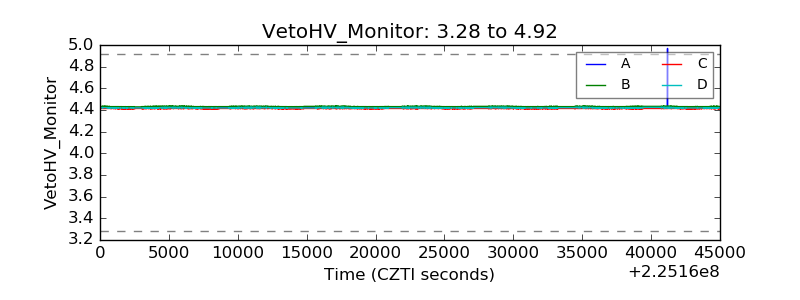 |
| Veto LLD |  |
| Alpha Counter |  |
| _CPM_Rate | 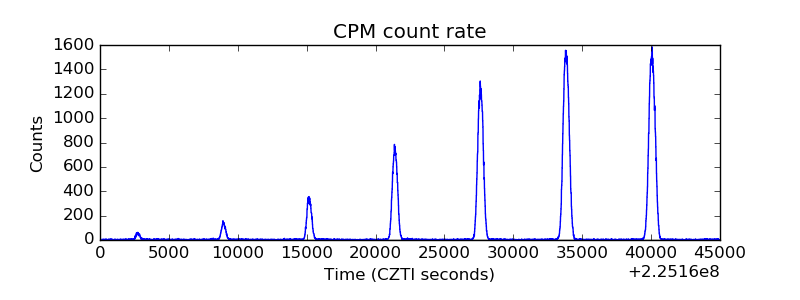 |
| CZT Counter | 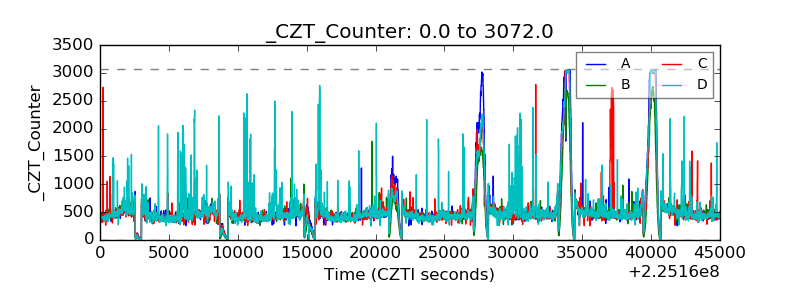 |
| +2.5 Volts monitor | 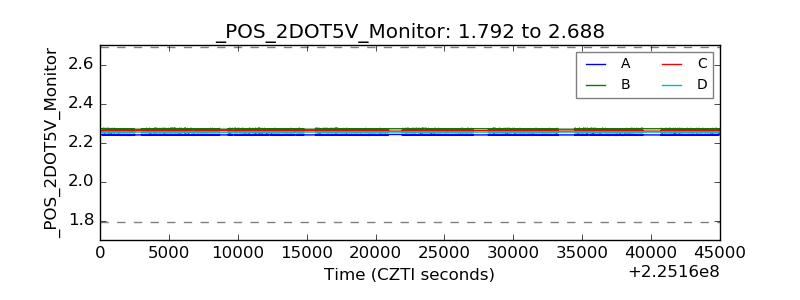 |
| +5 Volts monitor |  |
| _ROLL_ROT | 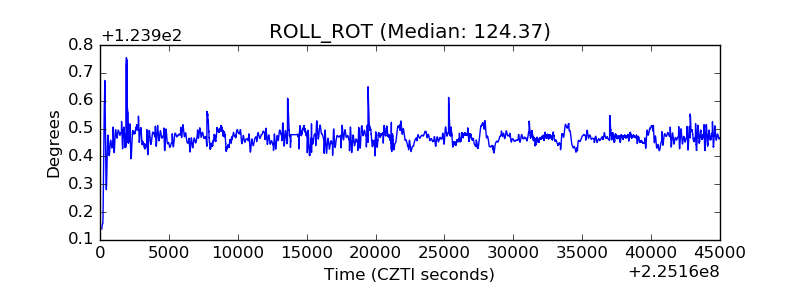 |
| _Roll_DEC |  |
| _Roll_RA |  |
| Veto Counter | 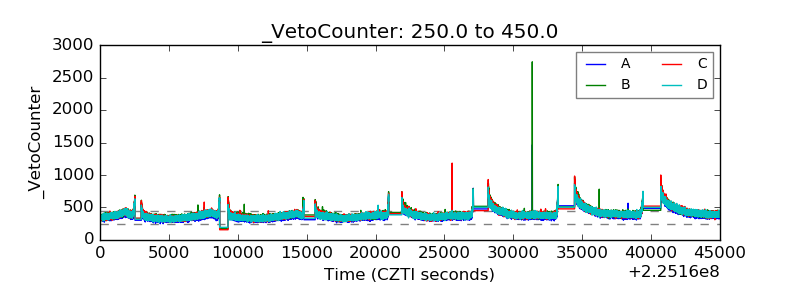 |