| Param | Original file | Final file |
|---|---|---|
| Filename | modeM0/AS1A02_024T01_9000001044cztM0_level2.evt | modeM0/AS1A02_024T01_9000001044cztM0_level2_quad_clean.evt |
| Size (bytes) | 475,672,320 | 84,288,960 |
| Size | 453.6 MB | 80.4 MB |
| Events in quadrant A | 3,219,243 | 522,132 |
| Events in quadrant B | 3,376,189 | 529,531 |
| Events in quadrant C | 3,486,453 | 524,898 |
| Events in quadrant D | 3,867,397 | 507,613 |
| Mode M9 | |||
|---|---|---|---|
| Quadrant | BADHDUFLAG | Total packets | Discarded packets |
| A | 0 | 21 | 0 |
| B | 0 | 21 | 0 |
| C | 0 | 21 | 0 |
| D | 0 | 21 | 0 |
| Mode M0 | |||
|---|---|---|---|
| Quadrant | BADHDUFLAG | Total packets | Discarded packets |
| A | 0 | 14020 | 0 |
| B | 0 | 14386 | 0 |
| C | 0 | 14625 | 0 |
| D | 0 | 16118 | 0 |
| Mode SS | |||
|---|---|---|---|
| Quadrant | BADHDUFLAG | Total packets | Discarded packets |
| A | 0 | 140 | 0 |
| B | 0 | 140 | 0 |
| C | 0 | 140 | 0 |
| D | 0 | 140 | 0 |
| Quadrant | Total seconds | Saturated seconds | Saturation percentage |
|---|---|---|---|
| A | 6713 | 85 | 1.266200% |
| B | 6713 | 122 | 1.817369% |
| C | 6713 | 109 | 1.623715% |
| D | 6713 | 150 | 2.234470% |
Noise dominated data is calculated using 1-second bins in cleaned event files. If a bin has >2000 counts, and if more than 50% of those come from <1% of pixels, then it is considered to be noise-dominated and hence unusable.
| Quadrant | # 1 sec bins | Bins with >0 counts | Bins with >2000 counts | High rate bins dominated by noise | Noise dominated (total time) | Noise dominated (detector-on time) | Marked lightcurve |
|---|---|---|---|---|---|---|---|
| A | 8843 | 6715 | 1 | 1 | 0.01% | 0.01% |  |
| B | 8843 | 6715 | 0 | 0 | 0.00% | 0.00% |  |
| C | 8843 | 6715 | 42 | 42 | 0.47% | 0.63% |  |
| D | 8843 | 6715 | 55 | 55 | 0.62% | 0.82% |  |
Top three noisy pixels from each quadrant. If the there are fewer than three noisy pixels in the level2.evt file, extra rows are filled as -1
| Pixel properties | Quadrant properties | ||||||
|---|---|---|---|---|---|---|---|
| Quadrant | DetID | PixID | Counts | Sigma | Mean | Median | Sigma |
| A | 15 | 239 | 21178 | 119.78 | 829 | 812 | 170.0 |
| A | 0 | 226 | 7818 | 41.2 | 829 | 812 | 170.0 |
| A | 12 | 194 | 7371 | 38.58 | 829 | 812 | 170.0 |
| B | 0 | 214 | 57809 | 355.48 | 835 | 813 | 160.3 |
| B | 0 | 219 | 16976 | 100.81 | 835 | 813 | 160.3 |
| B | 12 | 111 | 16030 | 94.91 | 835 | 813 | 160.3 |
| C | 8 | 229 | 158658 | 833.98 | 809 | 816 | 189.3 |
| C | 9 | 68 | 158564 | 833.49 | 809 | 816 | 189.3 |
| C | 10 | 22 | 8144 | 38.72 | 809 | 816 | 189.3 |
| D | 2 | 152 | 452571 | 2260.68 | 808 | 783 | 199.8 |
| D | 5 | 233 | 146323 | 728.26 | 808 | 783 | 199.8 |
| D | 12 | 233 | 98905 | 490.99 | 808 | 783 | 199.8 |
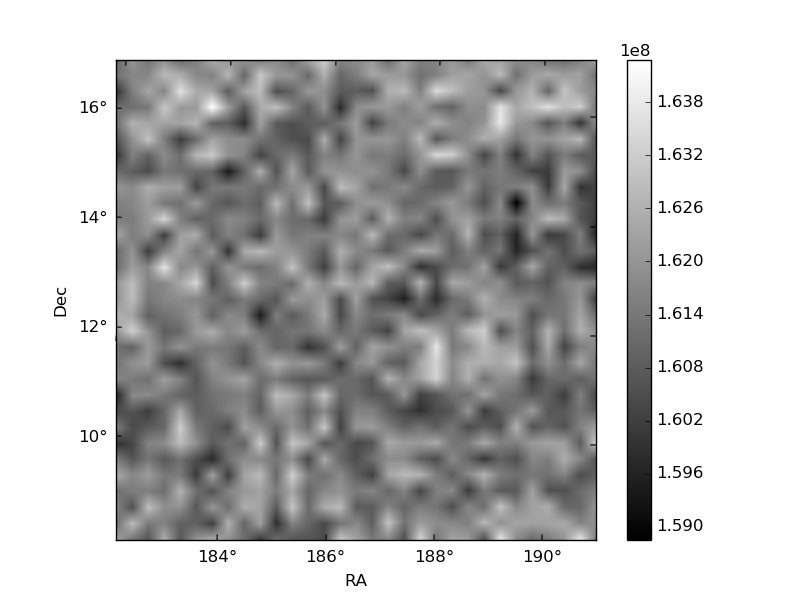
Histogram calculated using DETX and DETY for each event in the final _common_clean file
| Quadrant A |  |
 |
Quadrant B |
|---|---|---|---|
| Quadrant D |  |
 |
Quadrant C |
| Plot type | Count rate plots | Images |
|---|---|---|
| Comparison with Poisson distribution Blue bars denote a histogram of data divided into 1 sec bins. Red curve is a Poisson curve with rate = median count rate of data. |
 |
 |
| Quadrant-wise count rates Data is divided into 100 sec bins |
 |
|
| Module-wise count rates for Quadrant A Data is divided into 100 sec bins |
 |
 |
| Module-wise count rates for Quadrant B Data is divided into 100 sec bins |
 |
 |
| Module-wise count rates for Quadrant C Data is divided into 100 sec bins |
 |
 |
| Module-wise count rates for Quadrant D Data is divided into 100 sec bins |
 |
 |
| Parameter | Plot |
|---|---|
| CZT HV Monitor |  |
| D_VDD |  |
| Temperature 1 | 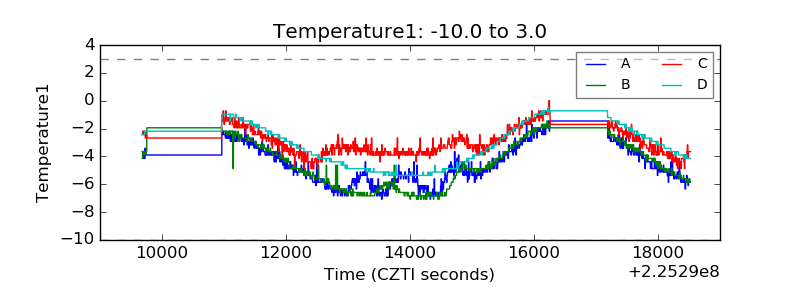 |
| Veto HV Monitor |  |
| Veto LLD |  |
| Alpha Counter |  |
| _CPM_Rate |  |
| CZT Counter |  |
| +2.5 Volts monitor |  |
| +5 Volts monitor |  |
| _ROLL_ROT |  |
| _Roll_DEC |  |
| _Roll_RA | 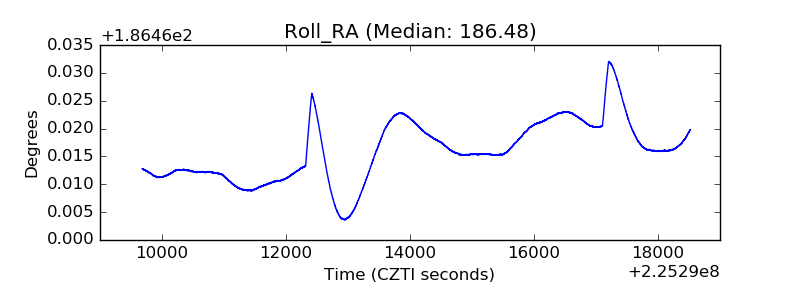 |
| Veto Counter |  |