| Param | Original file | Final file |
|---|---|---|
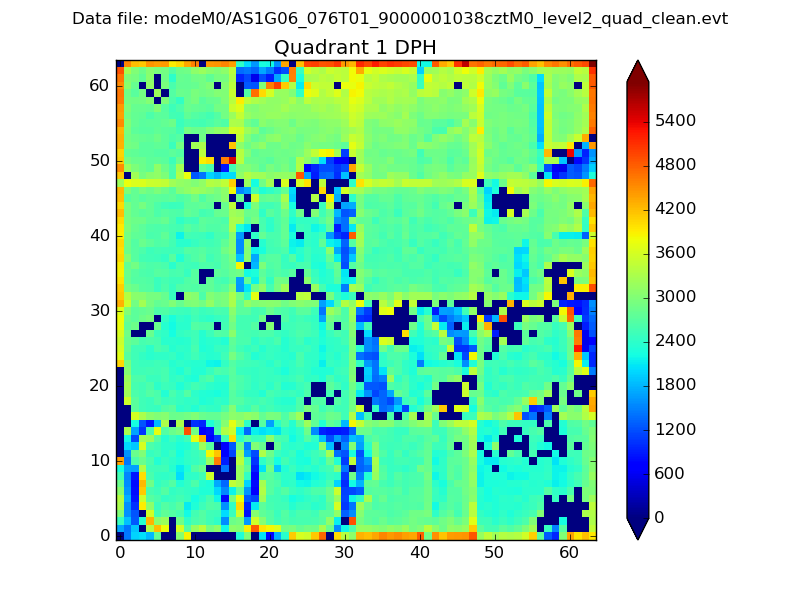
| Filename | modeM0/AS1G06_076T01_9000001038cztM0_level2.evt | modeM0/AS1G06_076T01_9000001038cztM0_level2_quad_clean.evt |
| Size (bytes) | 8,148,470,400 | 1,595,352,960 |
| Size | 7.6 GB | 1.5 GB |
| Events in quadrant A | 56,576,409 | 10,171,783 |
| Events in quadrant B | 57,811,951 | 10,334,080 |
| Events in quadrant C | 57,978,768 | 9,956,632 |
| Events in quadrant D | 66,196,968 | 9,521,560 |
| Mode M9 | |||
|---|---|---|---|
| Quadrant | BADHDUFLAG | Total packets | Discarded packets |
| A | 0 | 202 | 0 |
| B | 0 | 202 | 0 |
| C | 0 | 202 | 0 |
| D | 0 | 202 | 0 |
| Mode M0 | |||
|---|---|---|---|
| Quadrant | BADHDUFLAG | Total packets | Discarded packets |
| A | 0 | 251604 | 0 |
| B | 0 | 252998 | 0 |
| C | 0 | 257257 | 0 |
| D | 0 | 282983 | 0 |
| Mode SS | |||
|---|---|---|---|
| Quadrant | BADHDUFLAG | Total packets | Discarded packets |
| A | 0 | 2478 | 0 |
| B | 0 | 2478 | 0 |
| C | 0 | 2478 | 0 |
| D | 0 | 2478 | 0 |
| Quadrant | Total seconds | Saturated seconds | Saturation percentage |
|---|---|---|---|
| A | 121713 | 1417 | 1.164214% |
| B | 121712 | 1479 | 1.215164% |
| C | 121712 | 1826 | 1.500263% |
| D | 121714 | 2943 | 2.417963% |
Noise dominated data is calculated using 1-second bins in cleaned event files. If a bin has >2000 counts, and if more than 50% of those come from <1% of pixels, then it is considered to be noise-dominated and hence unusable.
| Quadrant | # 1 sec bins | Bins with >0 counts | Bins with >2000 counts | High rate bins dominated by noise | Noise dominated (total time) | Noise dominated (detector-on time) | Marked lightcurve |
|---|---|---|---|---|---|---|---|
| A | 141641 | 121730 | 87 | 87 | 0.06% | 0.07% | 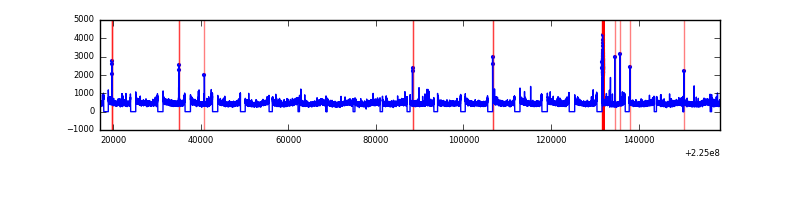 |
| B | 141641 | 121728 | 25 | 25 | 0.02% | 0.02% |  |
| C | 141641 | 121730 | 765 | 765 | 0.54% | 0.63% |  |
| D | 141641 | 121728 | 1614 | 1614 | 1.14% | 1.33% | 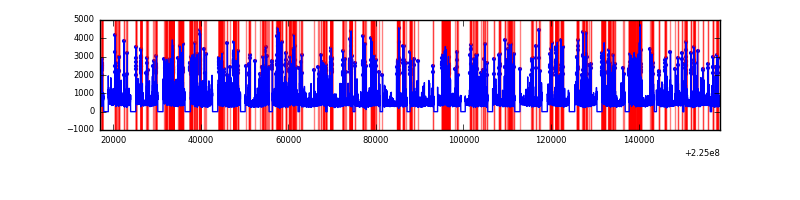 |
Top three noisy pixels from each quadrant. If the there are fewer than three noisy pixels in the level2.evt file, extra rows are filled as -1
| Pixel properties | Quadrant properties | ||||||
|---|---|---|---|---|---|---|---|
| Quadrant | DetID | PixID | Counts | Sigma | Mean | Median | Sigma |
| A | 14 | 111 | 352553 | 116.36 | 14508 | 14189 | 2908.0 |
| A | 13 | 14 | 258778 | 84.11 | 14508 | 14189 | 2908.0 |
| A | 0 | 226 | 138716 | 42.82 | 14508 | 14189 | 2908.0 |
| B | 0 | 219 | 276939 | 96.63 | 14626 | 14281 | 2718.2 |
| B | 12 | 111 | 276495 | 96.46 | 14626 | 14281 | 2718.2 |
| B | 0 | 214 | 259699 | 90.29 | 14626 | 14281 | 2718.2 |
| C | 9 | 68 | 2444910 | 752.2 | 14069 | 14125 | 3231.6 |
| C | 1 | 16 | 271021 | 79.5 | 14069 | 14125 | 3231.6 |
| C | 8 | 229 | 202510 | 58.3 | 14069 | 14125 | 3231.6 |
| D | 2 | 152 | 5259674 | 1549.18 | 13991 | 13547 | 3386.4 |
| D | 2 | 14 | 1861507 | 545.7 | 13991 | 13547 | 3386.4 |
| D | 2 | 136 | 1352224 | 395.31 | 13991 | 13547 | 3386.4 |
Histogram calculated using DETX and DETY for each event in the final _common_clean file
| Quadrant A |  |
 |
Quadrant B |
|---|---|---|---|
| Quadrant D |  |
 |
Quadrant C |
| Plot type | Count rate plots | Images |
|---|---|---|
| Comparison with Poisson distribution Blue bars denote a histogram of data divided into 1 sec bins. Red curve is a Poisson curve with rate = median count rate of data. |
 |
 |
| Quadrant-wise count rates Data is divided into 100 sec bins |
 |
|
| Module-wise count rates for Quadrant A Data is divided into 100 sec bins |
 |
 |
| Module-wise count rates for Quadrant B Data is divided into 100 sec bins |
 |
 |
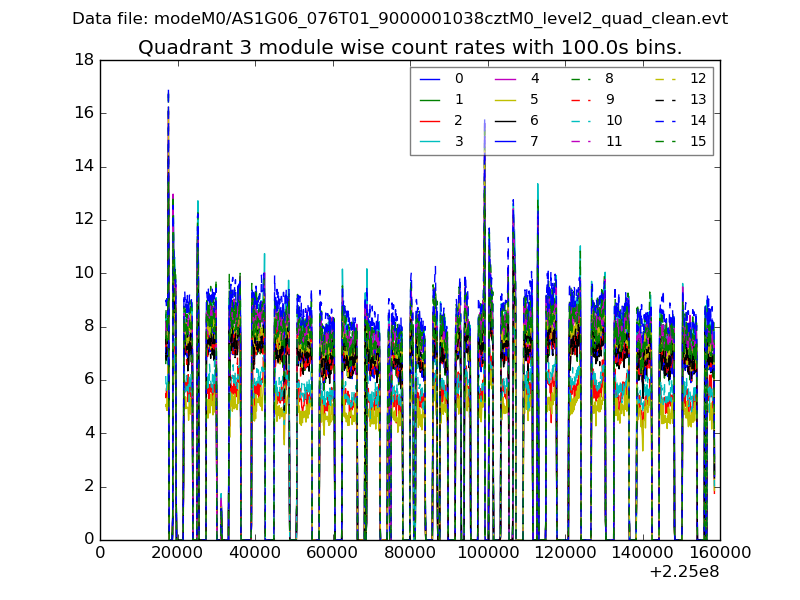
| Module-wise count rates for Quadrant C Data is divided into 100 sec bins |
 |
 |
| Module-wise count rates for Quadrant D Data is divided into 100 sec bins |
 |
 |
| Parameter | Plot |
|---|---|
| CZT HV Monitor |  |
| D_VDD |  |
| Temperature 1 |  |
| Veto HV Monitor |  |
| Veto LLD |  |
| Alpha Counter |  |
| _CPM_Rate |  |
| CZT Counter |  |
| +2.5 Volts monitor |  |
| +5 Volts monitor |  |
| _ROLL_ROT |  |
| _Roll_DEC |  |
| _Roll_RA |  |
| Veto Counter |  |