| Param | Original file | Final file |
|---|---|---|
| Filename | modeM0/AS1A02_134T01_9000001036cztM0_level2.evt | modeM0/AS1A02_134T01_9000001036cztM0_level2_quad_clean.evt |
| Size (bytes) | 5,776,839,360 | 1,188,308,160 |
| Size | 5.4 GB | 1.1 GB |
| Events in quadrant A | 38,684,951 | 7,718,759 |
| Events in quadrant B | 41,292,815 | 7,783,540 |
| Events in quadrant C | 43,993,057 | 7,493,498 |
| Events in quadrant D | 45,252,426 | 7,178,285 |
| Mode M9 | |||
|---|---|---|---|
| Quadrant | BADHDUFLAG | Total packets | Discarded packets |
| A | 0 | 125 | 0 |
| B | 0 | 125 | 0 |
| C | 0 | 125 | 0 |
| D | 0 | 125 | 0 |
| Mode SS | |||
|---|---|---|---|
| Quadrant | BADHDUFLAG | Total packets | Discarded packets |
| A | 0 | 1736 | 0 |
| B | 0 | 1736 | 0 |
| C | 0 | 1736 | 0 |
| D | 0 | 1736 | 0 |
| Mode M0 | |||
|---|---|---|---|
| Quadrant | BADHDUFLAG | Total packets | Discarded packets |
| A | 0 | 173646 | 0 |
| B | 0 | 179675 | 0 |
| C | 0 | 190110 | 0 |
| D | 0 | 195032 | 0 |
| Quadrant | Total seconds | Saturated seconds | Saturation percentage |
|---|---|---|---|
| A | 84877 | 662 | 0.779952% |
| B | 84877 | 899 | 1.059180% |
| C | 84877 | 1091 | 1.285389% |
| D | 84877 | 1772 | 2.087727% |
Noise dominated data is calculated using 1-second bins in cleaned event files. If a bin has >2000 counts, and if more than 50% of those come from <1% of pixels, then it is considered to be noise-dominated and hence unusable.
| Quadrant | # 1 sec bins | Bins with >0 counts | Bins with >2000 counts | High rate bins dominated by noise | Noise dominated (total time) | Noise dominated (detector-on time) | Marked lightcurve |
|---|---|---|---|---|---|---|---|
| A | 97793 | 84887 | 19 | 19 | 0.02% | 0.02% |  |
| B | 97793 | 84888 | 115 | 115 | 0.12% | 0.14% |  |
| C | 97793 | 84889 | 405 | 405 | 0.41% | 0.48% |  |
| D | 97793 | 84887 | 942 | 942 | 0.96% | 1.11% |  |
Top three noisy pixels from each quadrant. If the there are fewer than three noisy pixels in the level2.evt file, extra rows are filled as -1
| Pixel properties | Quadrant properties | ||||||
|---|---|---|---|---|---|---|---|
| Quadrant | DetID | PixID | Counts | Sigma | Mean | Median | Sigma |
| A | 13 | 248 | 189217 | 90.37 | 9929 | 9720 | 1986.3 |
| A | 13 | 14 | 154850 | 73.07 | 9929 | 9720 | 1986.3 |
| A | 0 | 226 | 94561 | 42.71 | 9929 | 9720 | 1986.3 |
| B | 0 | 214 | 987026 | 528.08 | 9980 | 9734 | 1850.6 |
| B | 0 | 187 | 983915 | 526.4 | 9980 | 9734 | 1850.6 |
| B | 0 | 219 | 318203 | 166.68 | 9980 | 9734 | 1850.6 |
| C | 9 | 68 | 5486417 | 2500.24 | 9605 | 9631 | 2190.5 |
| C | 8 | 229 | 557158 | 249.95 | 9605 | 9631 | 2190.5 |
| C | 1 | 16 | 395587 | 176.19 | 9605 | 9631 | 2190.5 |
| D | 2 | 152 | 1838739 | 795.53 | 9561 | 9276 | 2299.7 |
| D | 5 | 233 | 1707713 | 738.55 | 9561 | 9276 | 2299.7 |
| D | 14 | 34 | 1495358 | 646.21 | 9561 | 9276 | 2299.7 |
Histogram calculated using DETX and DETY for each event in the final _common_clean file
| Quadrant A | 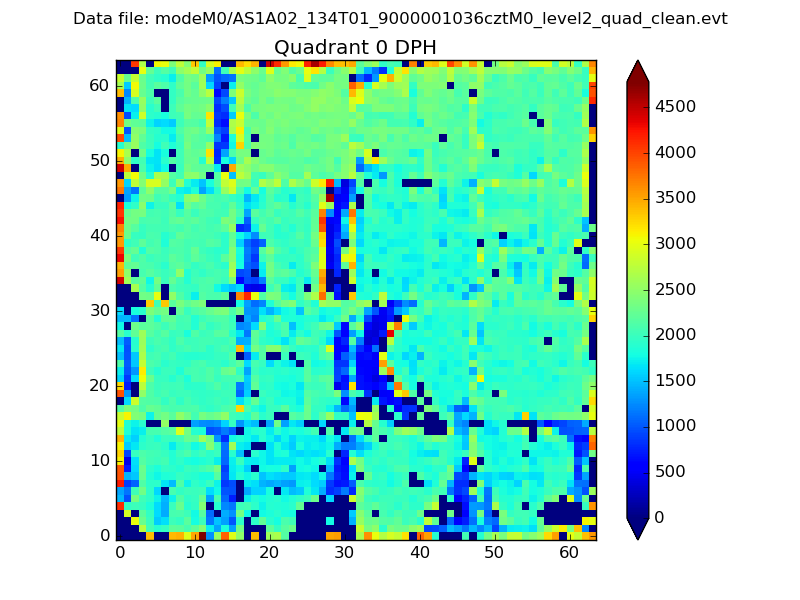 |
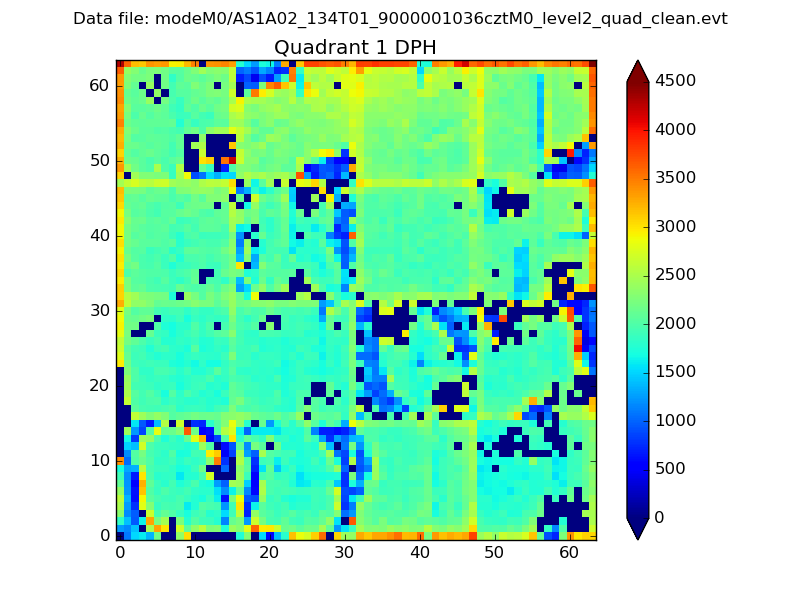 |
Quadrant B |
|---|---|---|---|
| Quadrant D |  |
 |
Quadrant C |
| Plot type | Count rate plots | Images |
|---|---|---|
| Comparison with Poisson distribution Blue bars denote a histogram of data divided into 1 sec bins. Red curve is a Poisson curve with rate = median count rate of data. |
 |
 |
| Quadrant-wise count rates Data is divided into 100 sec bins |
 |
|
| Module-wise count rates for Quadrant A Data is divided into 100 sec bins |
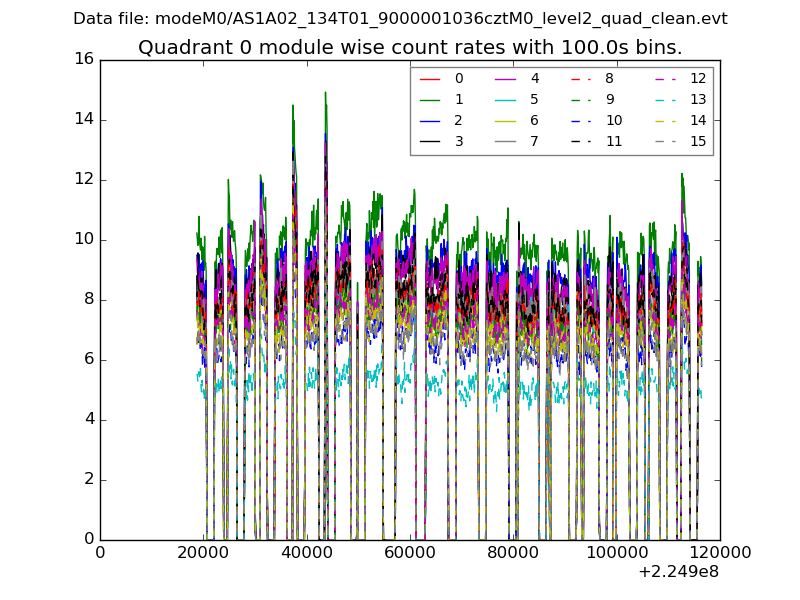 |
 |
| Module-wise count rates for Quadrant B Data is divided into 100 sec bins |
 |
 |
| Module-wise count rates for Quadrant C Data is divided into 100 sec bins |
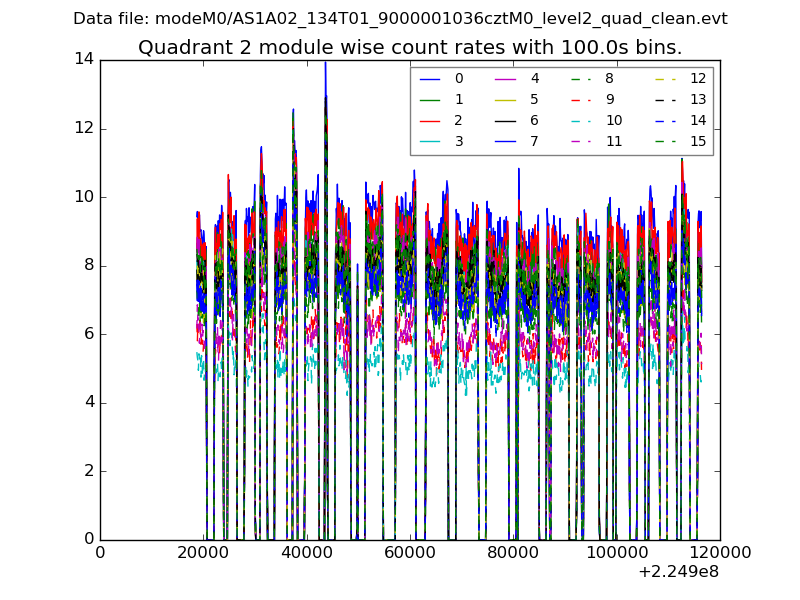 |
 |
| Module-wise count rates for Quadrant D Data is divided into 100 sec bins |
 |
 |
| Parameter | Plot |
|---|---|
| CZT HV Monitor |  |
| D_VDD | 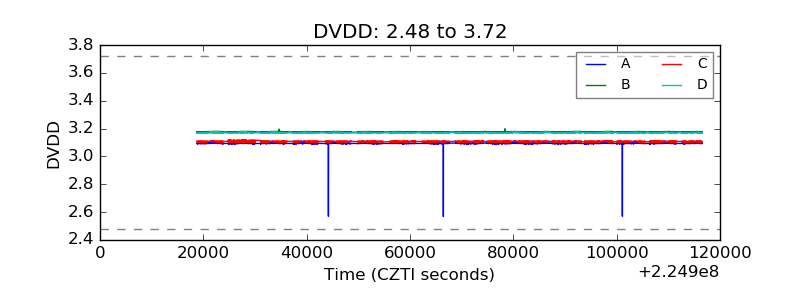 |
| Temperature 1 |  |
| Veto HV Monitor |  |
| Veto LLD |  |
| Alpha Counter |  |
| _CPM_Rate |  |
| CZT Counter |  |
| +2.5 Volts monitor | 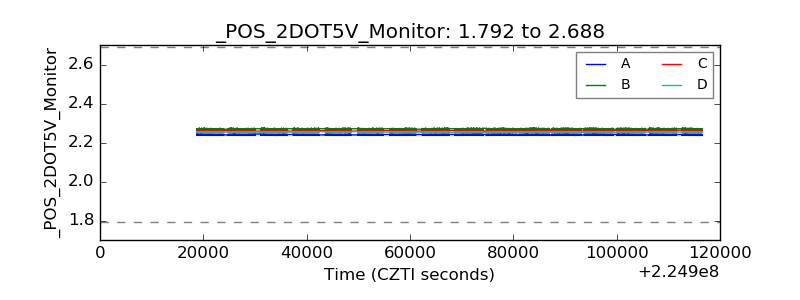 |
| +5 Volts monitor |  |
| _ROLL_ROT |  |
| _Roll_DEC |  |
| _Roll_RA |  |
| Veto Counter |  |