| Param | Original file | Final file |
|---|---|---|
| Filename | modeM0/AS1A02_058T02_9000001030cztM0_level2.evt | modeM0/AS1A02_058T02_9000001030cztM0_level2_quad_clean.evt |
| Size (bytes) | 738,809,280 | 174,012,480 |
| Size | 704.6 MB | 166.0 MB |
| Events in quadrant A | 5,221,290 | 1,125,246 |
| Events in quadrant B | 5,407,593 | 1,149,685 |
| Events in quadrant C | 5,149,814 | 1,144,770 |
| Events in quadrant D | 5,848,872 | 1,088,117 |
| Mode M0 | |||
|---|---|---|---|
| Quadrant | BADHDUFLAG | Total packets | Discarded packets |
| A | 0 | 23201 | 0 |
| B | 0 | 23642 | 0 |
| C | 0 | 22964 | 0 |
| D | 0 | 25289 | 0 |
| Mode SS | |||
|---|---|---|---|
| Quadrant | BADHDUFLAG | Total packets | Discarded packets |
| A | 0 | 224 | 0 |
| B | 0 | 224 | 0 |
| C | 0 | 224 | 0 |
| D | 0 | 224 | 0 |
| Mode M9 | |||
|---|---|---|---|
| Quadrant | BADHDUFLAG | Total packets | Discarded packets |
| A | 0 | 25 | 0 |
| B | 0 | 25 | 0 |
| C | 0 | 25 | 0 |
| D | 0 | 25 | 0 |
| Quadrant | Total seconds | Saturated seconds | Saturation percentage |
|---|---|---|---|
| A | 11024 | 160 | 1.451379% |
| B | 11024 | 196 | 1.777939% |
| C | 11024 | 126 | 1.142961% |
| D | 11024 | 259 | 2.349419% |
Noise dominated data is calculated using 1-second bins in cleaned event files. If a bin has >2000 counts, and if more than 50% of those come from <1% of pixels, then it is considered to be noise-dominated and hence unusable.
| Quadrant | # 1 sec bins | Bins with >0 counts | Bins with >2000 counts | High rate bins dominated by noise | Noise dominated (total time) | Noise dominated (detector-on time) | Marked lightcurve |
|---|---|---|---|---|---|---|---|
| A | 13494 | 11025 | 1 | 1 | 0.01% | 0.01% |  |
| B | 13494 | 11025 | 6 | 6 | 0.04% | 0.05% |  |
| C | 13494 | 11026 | 1 | 1 | 0.01% | 0.01% |  |
| D | 13494 | 11026 | 105 | 105 | 0.78% | 0.95% |  |
Top three noisy pixels from each quadrant. If the there are fewer than three noisy pixels in the level2.evt file, extra rows are filled as -1
| Pixel properties | Quadrant properties | ||||||
|---|---|---|---|---|---|---|---|
| Quadrant | DetID | PixID | Counts | Sigma | Mean | Median | Sigma |
| A | 15 | 234 | 45587 | 164.04 | 1330 | 1304 | 269.9 |
| A | 15 | 239 | 26627 | 93.81 | 1330 | 1304 | 269.9 |
| A | 0 | 23 | 17769 | 60.99 | 1330 | 1304 | 269.9 |
| B | 0 | 214 | 75674 | 290.69 | 1349 | 1320 | 255.8 |
| B | 4 | 173 | 72954 | 280.06 | 1349 | 1320 | 255.8 |
| B | 4 | 81 | 29215 | 109.06 | 1349 | 1320 | 255.8 |
| C | 1 | 16 | 20075 | 61.51 | 1314 | 1322 | 304.9 |
| C | 13 | 61 | 10167 | 29.01 | 1314 | 1322 | 304.9 |
| C | 8 | 222 | 6808 | 17.99 | 1314 | 1322 | 304.9 |
| D | 2 | 14 | 229174 | 713.81 | 1297 | 1259 | 319.3 |
| D | 2 | 152 | 208215 | 648.17 | 1297 | 1259 | 319.3 |
| D | 14 | 34 | 148568 | 461.36 | 1297 | 1259 | 319.3 |
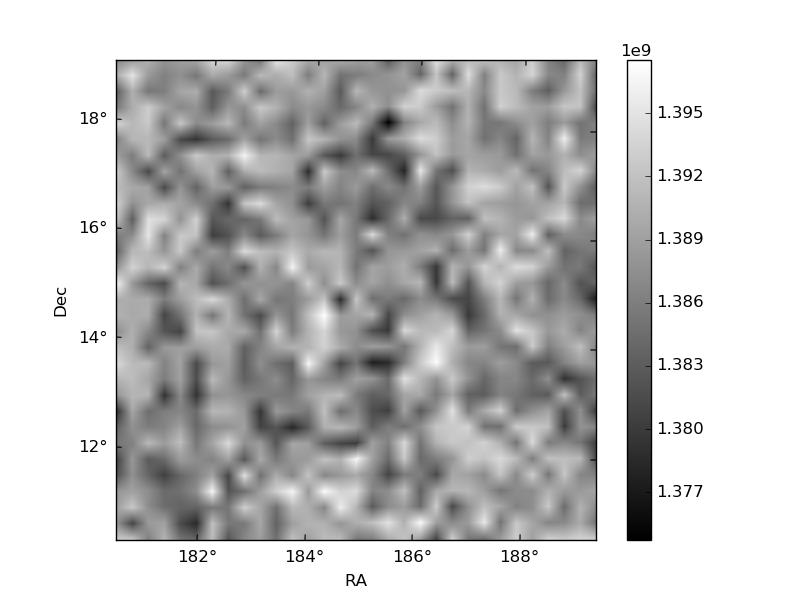
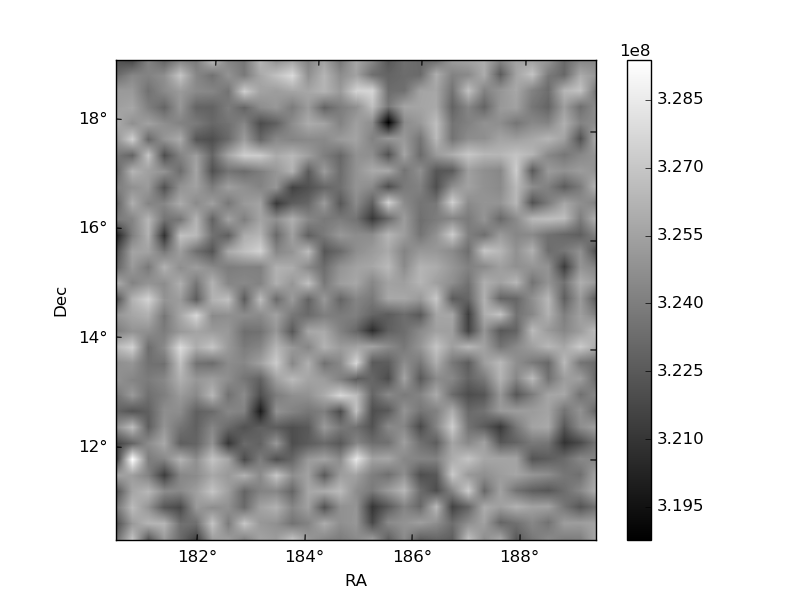
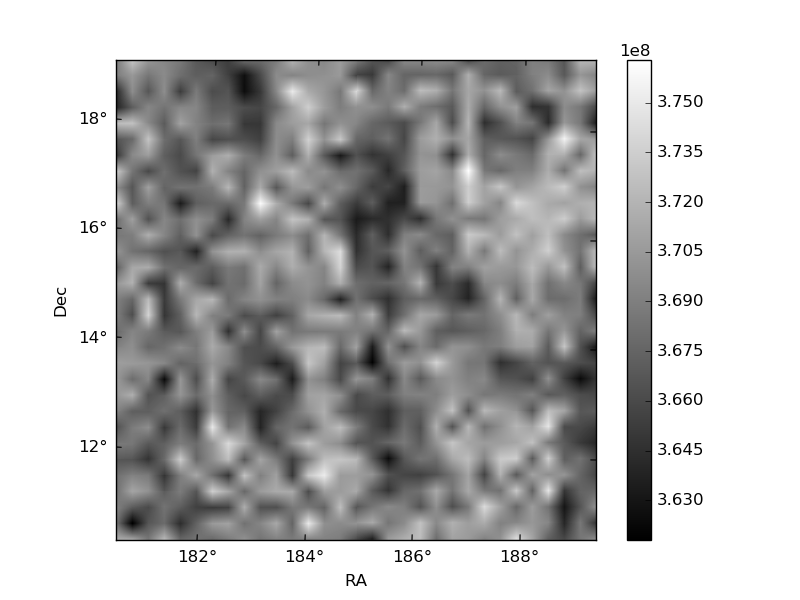
Histogram calculated using DETX and DETY for each event in the final _common_clean file
| Quadrant A |  |
 |
Quadrant B |
|---|---|---|---|
| Quadrant D |  |
 |
Quadrant C |
| Plot type | Count rate plots | Images |
|---|---|---|
| Comparison with Poisson distribution Blue bars denote a histogram of data divided into 1 sec bins. Red curve is a Poisson curve with rate = median count rate of data. |
 |
 |
| Quadrant-wise count rates Data is divided into 100 sec bins |
 |
|
| Module-wise count rates for Quadrant A Data is divided into 100 sec bins |
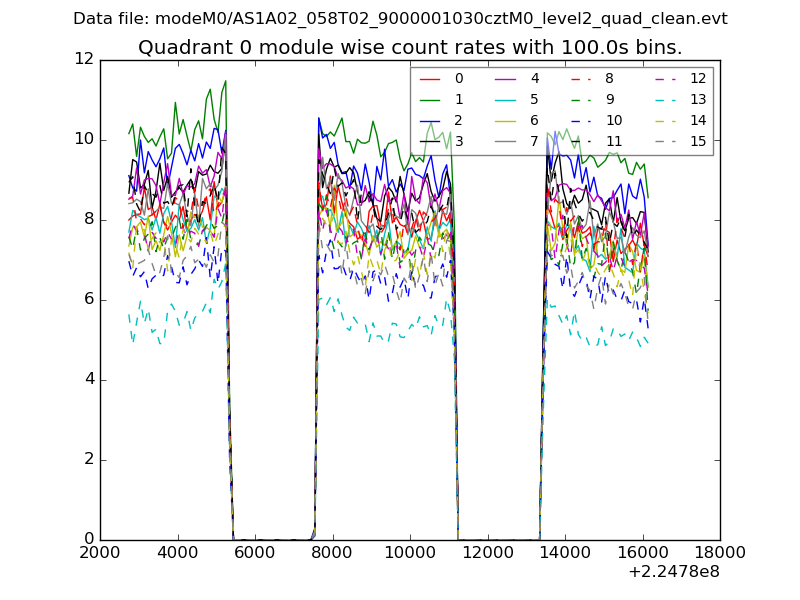 |
 |
| Module-wise count rates for Quadrant B Data is divided into 100 sec bins |
 |
 |
| Module-wise count rates for Quadrant C Data is divided into 100 sec bins |
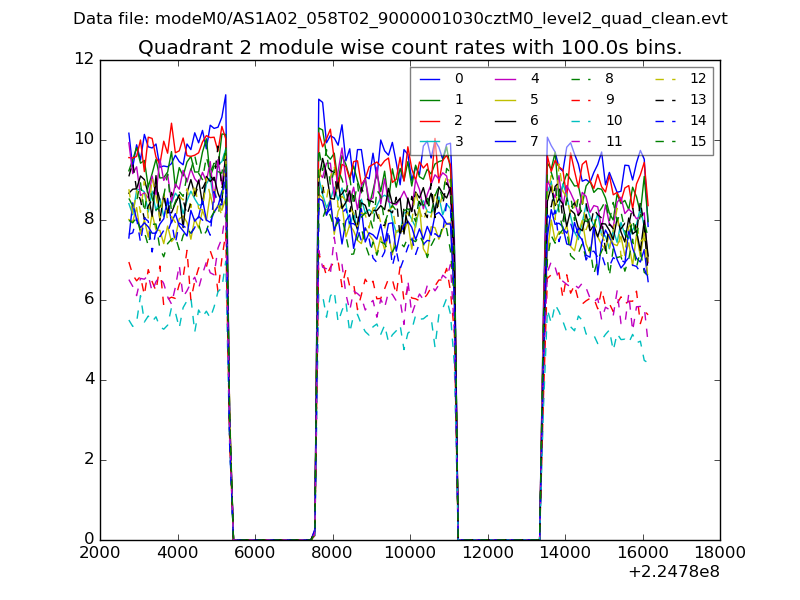 |
 |
| Module-wise count rates for Quadrant D Data is divided into 100 sec bins |
 |
 |
| Parameter | Plot |
|---|---|
| CZT HV Monitor |  |
| D_VDD | 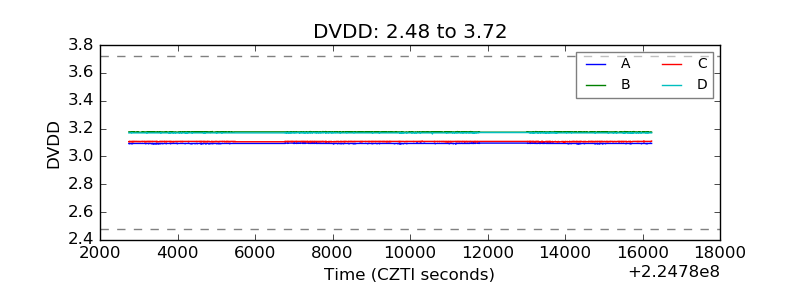 |
| Temperature 1 |  |
| Veto HV Monitor |  |
| Veto LLD |  |
| Alpha Counter |  |
| _CPM_Rate |  |
| CZT Counter |  |
| +2.5 Volts monitor |  |
| +5 Volts monitor |  |
| _ROLL_ROT |  |
| _Roll_DEC |  |
| _Roll_RA |  |
| Veto Counter | 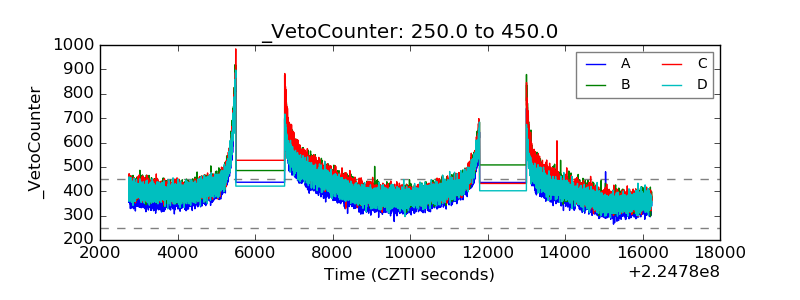 |