| Param | Original file | Final file |
|---|---|---|
| Filename | modeM0/AS1G06_116T01_9000001026cztM0_level2.evt | modeM0/AS1G06_116T01_9000001026cztM0_level2_quad_clean.evt |
| Size (bytes) | 4,346,075,520 | 1,213,323,840 |
| Size | 4.0 GB | 1.1 GB |
| Events in quadrant A | 30,353,185 | 8,069,179 |
| Events in quadrant B | 31,402,991 | 8,234,231 |
| Events in quadrant C | 29,433,695 | 8,151,949 |
| Events in quadrant D | 35,955,589 | 7,754,117 |
| Mode M0 | |||
|---|---|---|---|
| Quadrant | BADHDUFLAG | Total packets | Discarded packets |
| A | 0 | 137723 | 0 |
| B | 0 | 139577 | 0 |
| C | 0 | 135444 | 0 |
| D | 0 | 150452 | 0 |
| Mode M9 | |||
|---|---|---|---|
| Quadrant | BADHDUFLAG | Total packets | Discarded packets |
| A | 0 | 111 | 0 |
| B | 0 | 111 | 0 |
| C | 0 | 111 | 0 |
| D | 0 | 111 | 0 |
| Mode SS | |||
|---|---|---|---|
| Quadrant | BADHDUFLAG | Total packets | Discarded packets |
| A | 0 | 1354 | 0 |
| B | 0 | 1354 | 0 |
| C | 0 | 1354 | 0 |
| D | 0 | 1354 | 0 |
| Quadrant | Total seconds | Saturated seconds | Saturation percentage |
|---|---|---|---|
| A | 66279 | 748 | 1.128563% |
| B | 66278 | 746 | 1.125562% |
| C | 66279 | 426 | 0.642738% |
| D | 66279 | 1045 | 1.576668% |
Noise dominated data is calculated using 1-second bins in cleaned event files. If a bin has >2000 counts, and if more than 50% of those come from <1% of pixels, then it is considered to be noise-dominated and hence unusable.
| Quadrant | # 1 sec bins | Bins with >0 counts | Bins with >2000 counts | High rate bins dominated by noise | Noise dominated (total time) | Noise dominated (detector-on time) | Marked lightcurve |
|---|---|---|---|---|---|---|---|
| A | 77434 | 66288 | 158 | 158 | 0.20% | 0.24% |  |
| B | 77434 | 66291 | 89 | 89 | 0.11% | 0.13% |  |
| C | 77434 | 66291 | 8 | 8 | 0.01% | 0.01% |  |
| D | 77434 | 66287 | 533 | 533 | 0.69% | 0.80% |  |
Top three noisy pixels from each quadrant. If the there are fewer than three noisy pixels in the level2.evt file, extra rows are filled as -1
| Pixel properties | Quadrant properties | ||||||
|---|---|---|---|---|---|---|---|
| Quadrant | DetID | PixID | Counts | Sigma | Mean | Median | Sigma |
| A | 15 | 239 | 706262 | 460.45 | 7613 | 7447 | 1517.7 |
| A | 15 | 234 | 174373 | 109.99 | 7613 | 7447 | 1517.7 |
| A | 8 | 15 | 105777 | 64.79 | 7613 | 7447 | 1517.7 |
| B | 0 | 214 | 780193 | 540.21 | 7697 | 7512 | 1430.3 |
| B | 4 | 173 | 303952 | 207.25 | 7697 | 7512 | 1430.3 |
| B | 4 | 81 | 266638 | 181.17 | 7697 | 7512 | 1430.3 |
| C | 9 | 68 | 120966 | 66.76 | 7469 | 7493 | 1699.8 |
| C | 1 | 16 | 106573 | 58.29 | 7469 | 7493 | 1699.8 |
| C | 13 | 61 | 58200 | 29.83 | 7469 | 7493 | 1699.8 |
| D | 12 | 221 | 2092916 | 1160.38 | 7415 | 7173 | 1797.5 |
| D | 2 | 14 | 1256748 | 695.19 | 7415 | 7173 | 1797.5 |
| D | 13 | 105 | 943978 | 521.18 | 7415 | 7173 | 1797.5 |
Histogram calculated using DETX and DETY for each event in the final _common_clean file
| Quadrant A |  |
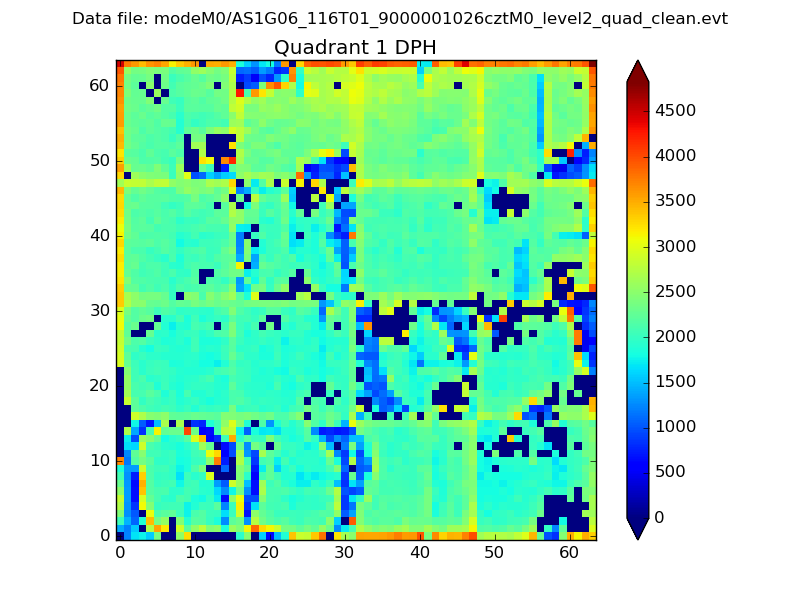 |
Quadrant B |
|---|---|---|---|
| Quadrant D |  |
 |
Quadrant C |
| Plot type | Count rate plots | Images |
|---|---|---|
| Comparison with Poisson distribution Blue bars denote a histogram of data divided into 1 sec bins. Red curve is a Poisson curve with rate = median count rate of data. |
 |
 |
| Quadrant-wise count rates Data is divided into 100 sec bins |
 |
|
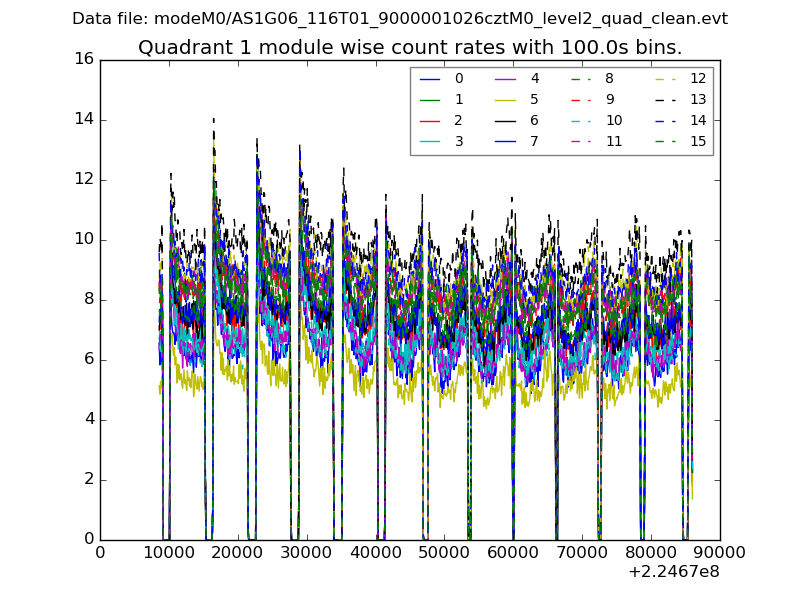
| Module-wise count rates for Quadrant A Data is divided into 100 sec bins |
 |
 |
| Module-wise count rates for Quadrant B Data is divided into 100 sec bins |
 |
 |
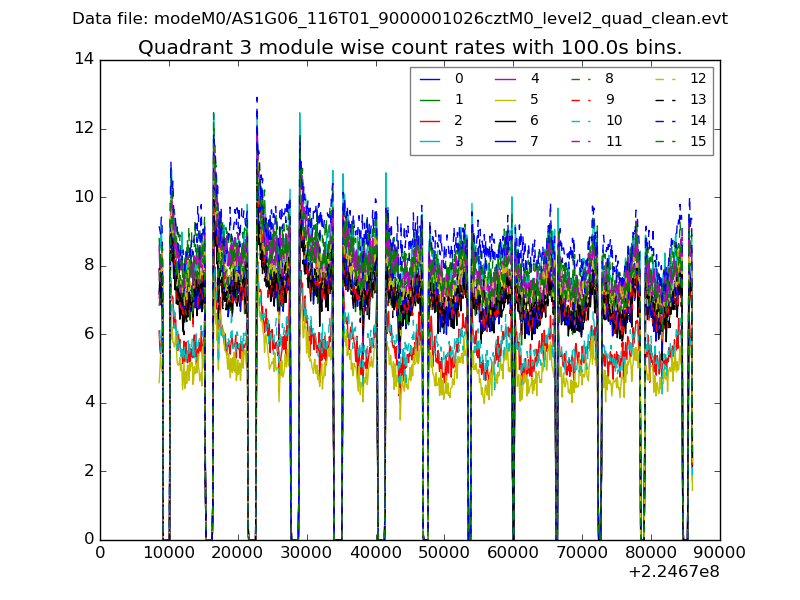
| Module-wise count rates for Quadrant C Data is divided into 100 sec bins |
 |
 |
| Module-wise count rates for Quadrant D Data is divided into 100 sec bins |
 |
 |
| Parameter | Plot |
|---|---|
| CZT HV Monitor |  |
| D_VDD |  |
| Temperature 1 |  |
| Veto HV Monitor |  |
| Veto LLD | 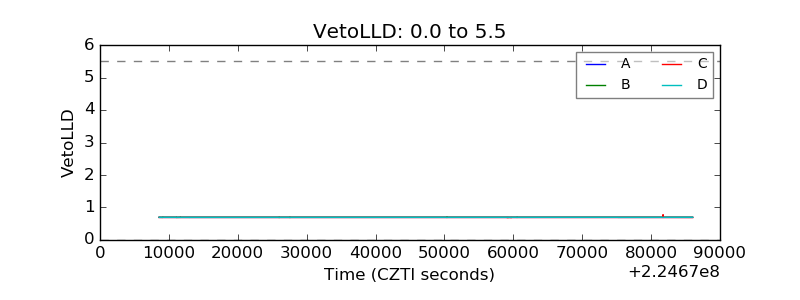 |
| Alpha Counter | 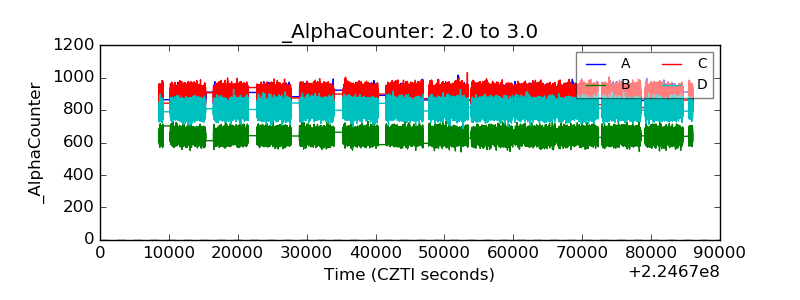 |
| _CPM_Rate |  |
| CZT Counter |  |
| +2.5 Volts monitor |  |
| +5 Volts monitor |  |
| _ROLL_ROT | 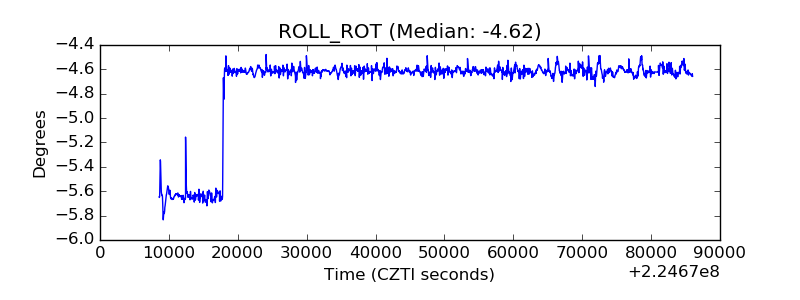 |
| _Roll_DEC | 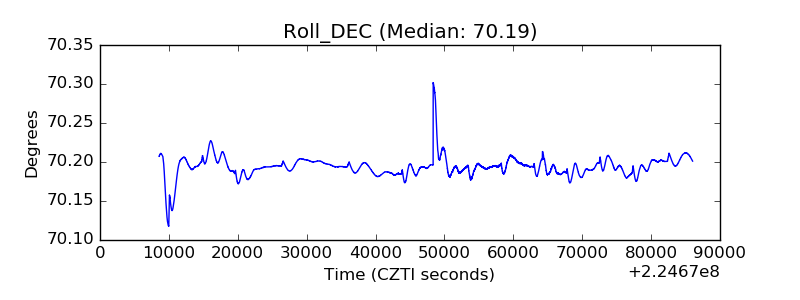 |
| _Roll_RA |  |
| Veto Counter |  |