| Param | Original file | Final file |
|---|---|---|
| Filename | modeM0/AS1A02_108T01_9000001024cztM0_level2.evt | modeM0/AS1A02_108T01_9000001024cztM0_level2_quad_clean.evt |
| Size (bytes) | 12,487,970,880 | 1,973,761,920 |
| Size | 11.6 GB | 1.8 GB |
| Events in quadrant A | 116,801,046 | 11,844,481 |
| Events in quadrant B | 76,731,650 | 12,715,134 |
| Events in quadrant C | 87,133,958 | 12,342,342 |
| Events in quadrant D | 86,674,694 | 11,837,961 |
| Mode M0 | |||
|---|---|---|---|
| Quadrant | BADHDUFLAG | Total packets | Discarded packets |
| A | 0 | 457033 | 0 |
| B | 0 | 335699 | 0 |
| C | 0 | 367980 | 0 |
| D | 0 | 366874 | 0 |
| Mode SS | |||
|---|---|---|---|
| Quadrant | BADHDUFLAG | Total packets | Discarded packets |
| A | 0 | 3282 | 0 |
| B | 0 | 3282 | 0 |
| C | 0 | 3282 | 0 |
| D | 0 | 3282 | 0 |
| Mode M9 | |||
|---|---|---|---|
| Quadrant | BADHDUFLAG | Total packets | Discarded packets |
| A | 0 | 253 | 0 |
| B | 0 | 253 | 0 |
| C | 0 | 253 | 0 |
| D | 0 | 253 | 0 |
| Quadrant | Total seconds | Saturated seconds | Saturation percentage |
|---|---|---|---|
| A | 161149 | 18583 | 11.531564% |
| B | 161149 | 1827 | 1.133733% |
| C | 161149 | 1663 | 1.031964% |
| D | 161149 | 3165 | 1.964021% |
Noise dominated data is calculated using 1-second bins in cleaned event files. If a bin has >2000 counts, and if more than 50% of those come from <1% of pixels, then it is considered to be noise-dominated and hence unusable.
| Quadrant | # 1 sec bins | Bins with >0 counts | Bins with >2000 counts | High rate bins dominated by noise | Noise dominated (total time) | Noise dominated (detector-on time) | Marked lightcurve |
|---|---|---|---|---|---|---|---|
| A | 186410 | 161174 | 15182 | 15182 | 8.14% | 9.42% |  |
| B | 186410 | 161176 | 46 | 46 | 0.02% | 0.03% |  |
| C | 186410 | 161178 | 160 | 160 | 0.09% | 0.10% |  |
| D | 186410 | 161176 | 1508 | 1508 | 0.81% | 0.94% | 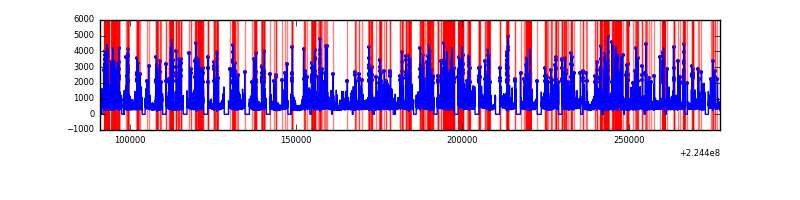 |
Top three noisy pixels from each quadrant. If the there are fewer than three noisy pixels in the level2.evt file, extra rows are filled as -1
| Pixel properties | Quadrant properties | ||||||
|---|---|---|---|---|---|---|---|
| Quadrant | DetID | PixID | Counts | Sigma | Mean | Median | Sigma |
| A | 15 | 239 | 45349216 | 12427.67 | 18258 | 17873 | 3647.6 |
| A | 15 | 234 | 869892 | 233.58 | 18258 | 17873 | 3647.6 |
| A | 0 | 226 | 173236 | 42.59 | 18258 | 17873 | 3647.6 |
| B | 0 | 214 | 1389278 | 380.39 | 19260 | 18805 | 3602.8 |
| B | 12 | 111 | 379741 | 100.18 | 19260 | 18805 | 3602.8 |
| B | 11 | 111 | 303386 | 78.99 | 19260 | 18805 | 3602.8 |
| C | 9 | 68 | 13671548 | 3193.97 | 18592 | 18689 | 4274.6 |
| C | 1 | 16 | 693842 | 157.95 | 18592 | 18689 | 4274.6 |
| C | 13 | 61 | 143898 | 29.29 | 18592 | 18689 | 4274.6 |
| D | 2 | 14 | 3268214 | 729.43 | 18472 | 17932 | 4455.9 |
| D | 13 | 105 | 3181487 | 709.97 | 18472 | 17932 | 4455.9 |
| D | 1 | 52 | 1905095 | 423.52 | 18472 | 17932 | 4455.9 |
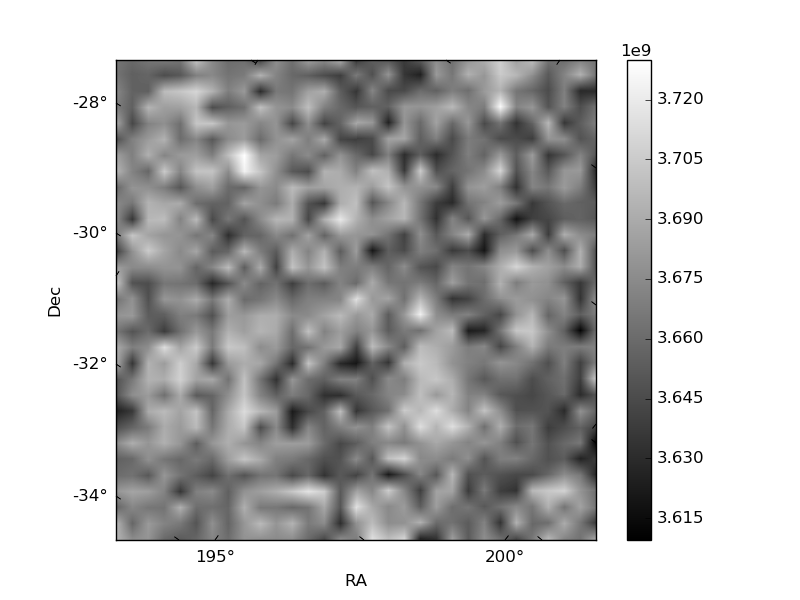
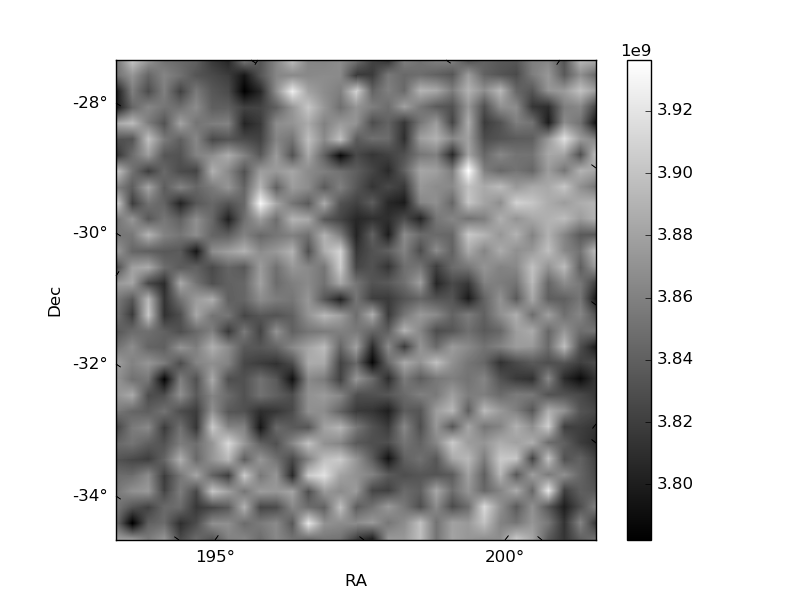
Histogram calculated using DETX and DETY for each event in the final _common_clean file
| Quadrant A | 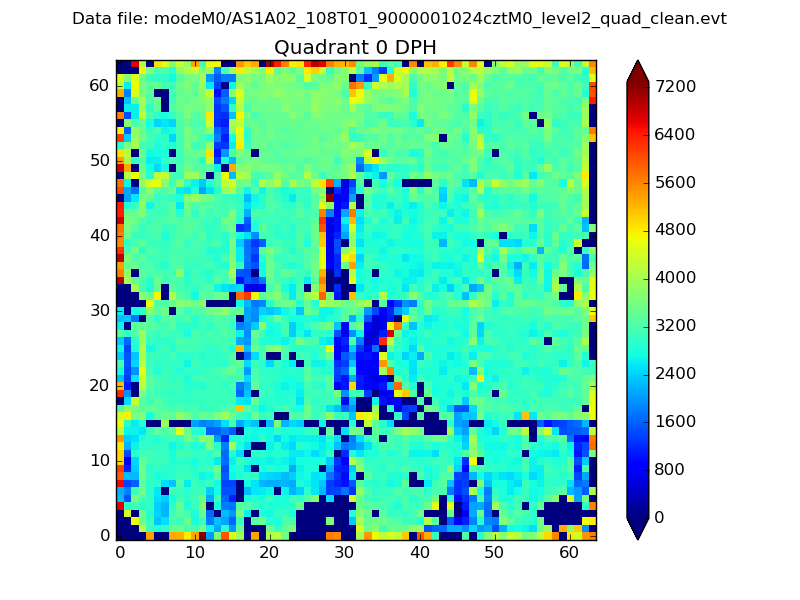 |
 |
Quadrant B |
|---|---|---|---|
| Quadrant D |  |
 |
Quadrant C |
| Plot type | Count rate plots | Images |
|---|---|---|
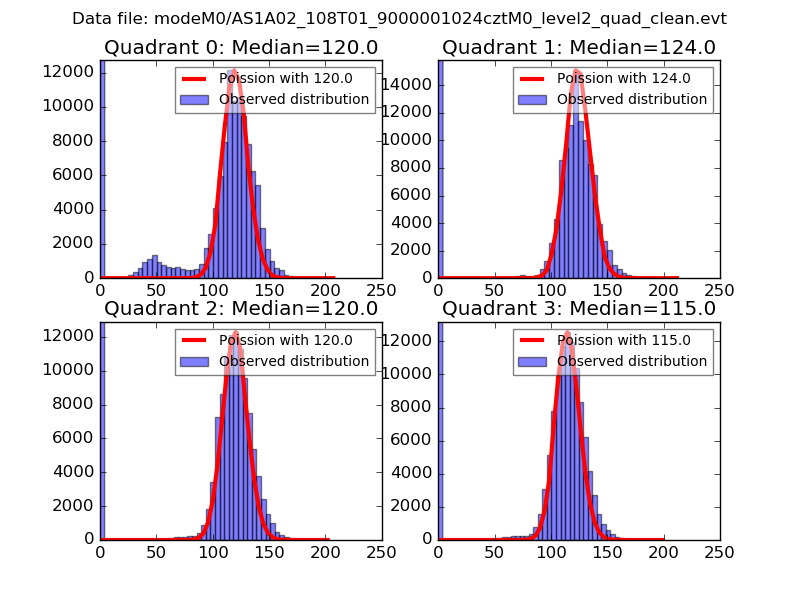
| Comparison with Poisson distribution Blue bars denote a histogram of data divided into 1 sec bins. Red curve is a Poisson curve with rate = median count rate of data. |
 |
 |
| Quadrant-wise count rates Data is divided into 100 sec bins |
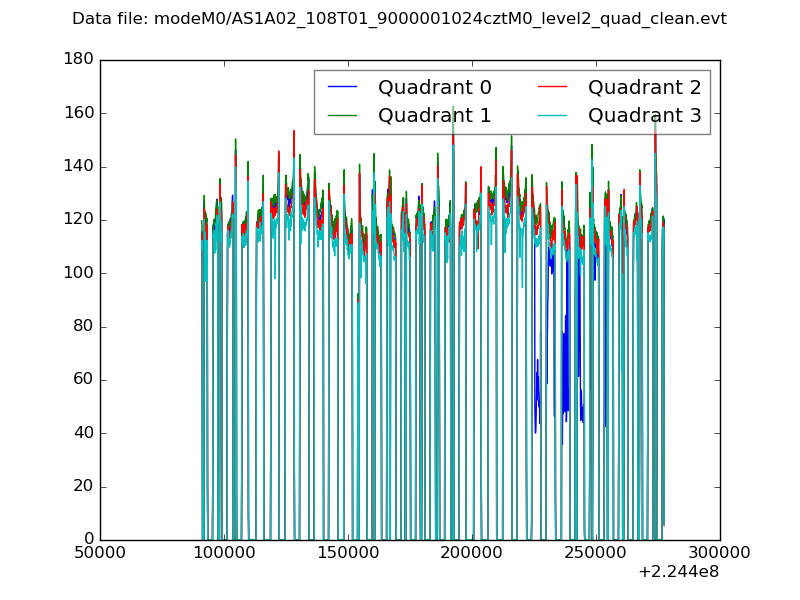 |
|
| Module-wise count rates for Quadrant A Data is divided into 100 sec bins |
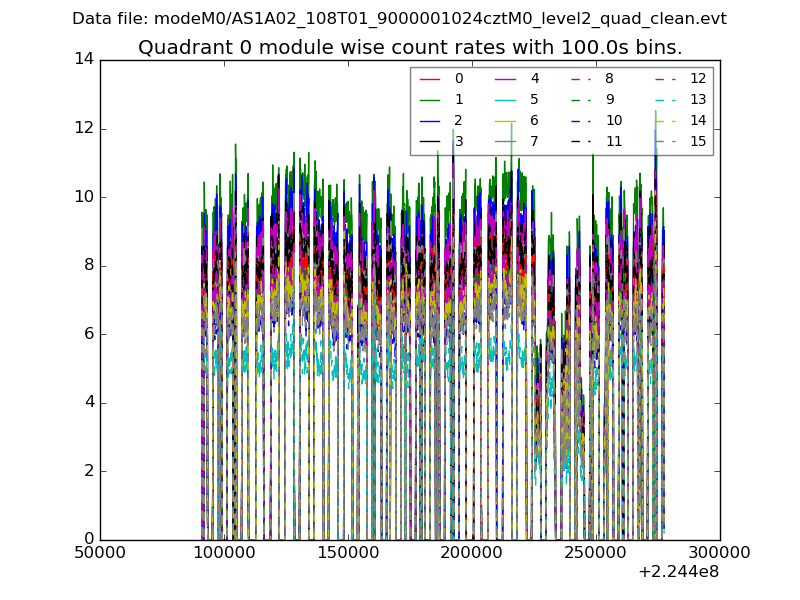 |
 |
| Module-wise count rates for Quadrant B Data is divided into 100 sec bins |
 |
 |
| Module-wise count rates for Quadrant C Data is divided into 100 sec bins |
 |
 |
| Module-wise count rates for Quadrant D Data is divided into 100 sec bins |
 |
 |
| Parameter | Plot |
|---|---|
| CZT HV Monitor | 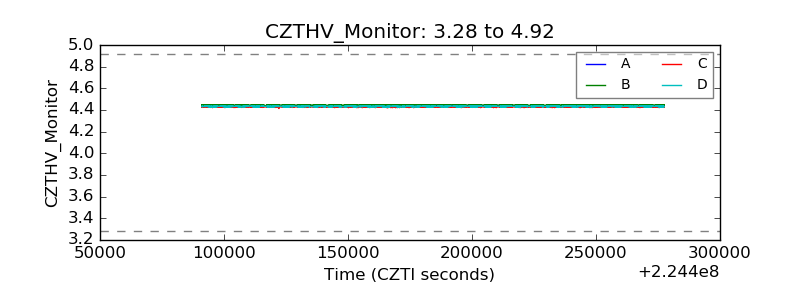 |
| D_VDD | 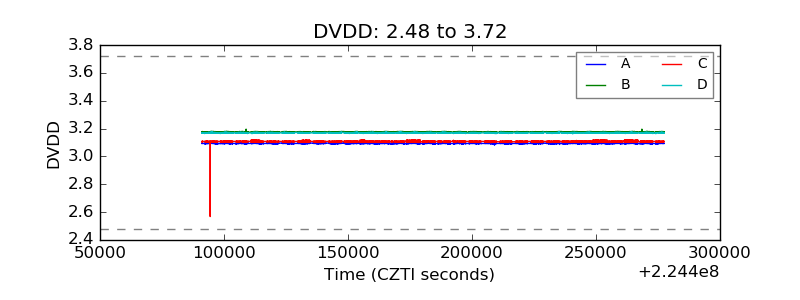 |
| Temperature 1 |  |
| Veto HV Monitor |  |
| Veto LLD | 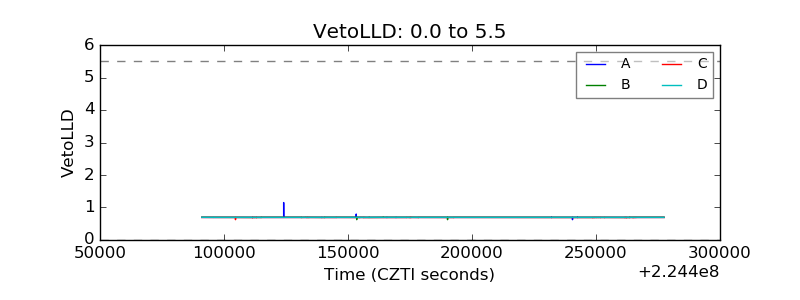 |
| Alpha Counter |  |
| _CPM_Rate | 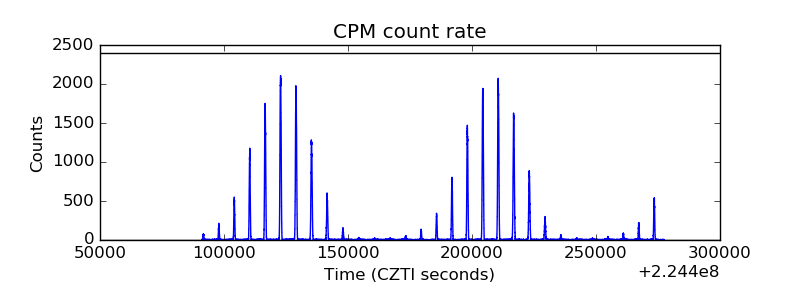 |
| CZT Counter |  |
| +2.5 Volts monitor |  |
| +5 Volts monitor |  |
| _ROLL_ROT |  |
| _Roll_DEC |  |
| _Roll_RA |  |
| Veto Counter |  |