| Param | Original file | Final file |
|---|---|---|
| Filename | modeM0/AS1A02_150T04_9000001022cztM0_level2.evt | modeM0/AS1A02_150T04_9000001022cztM0_level2_quad_clean.evt |
| Size (bytes) | 3,603,159,360 | 657,751,680 |
| Size | 3.4 GB | 627.3 MB |
| Events in quadrant A | 24,082,205 | 4,088,486 |
| Events in quadrant B | 25,664,616 | 4,179,967 |
| Events in quadrant C | 29,447,943 | 4,176,137 |
| Events in quadrant D | 26,516,640 | 4,008,439 |
| Mode SS | |||
|---|---|---|---|
| Quadrant | BADHDUFLAG | Total packets | Discarded packets |
| A | 0 | 1030 | 0 |
| B | 0 | 1030 | 0 |
| C | 0 | 1030 | 0 |
| D | 0 | 1030 | 0 |
| Mode M9 | |||
|---|---|---|---|
| Quadrant | BADHDUFLAG | Total packets | Discarded packets |
| A | 0 | 75 | 0 |
| B | 0 | 75 | 0 |
| C | 0 | 75 | 0 |
| D | 0 | 75 | 0 |
| Mode M0 | |||
|---|---|---|---|
| Quadrant | BADHDUFLAG | Total packets | Discarded packets |
| A | 0 | 107032 | 0 |
| B | 0 | 110470 | 0 |
| C | 0 | 120940 | 0 |
| D | 0 | 114307 | 0 |
| Quadrant | Total seconds | Saturated seconds | Saturation percentage |
|---|---|---|---|
| A | 50572 | 762 | 1.506763% |
| B | 50572 | 878 | 1.736139% |
| C | 50572 | 525 | 1.038124% |
| D | 50572 | 896 | 1.771731% |
Noise dominated data is calculated using 1-second bins in cleaned event files. If a bin has >2000 counts, and if more than 50% of those come from <1% of pixels, then it is considered to be noise-dominated and hence unusable.
| Quadrant | # 1 sec bins | Bins with >0 counts | Bins with >2000 counts | High rate bins dominated by noise | Noise dominated (total time) | Noise dominated (detector-on time) | Marked lightcurve |
|---|---|---|---|---|---|---|---|
| A | 58093 | 50587 | 157 | 157 | 0.27% | 0.31% | 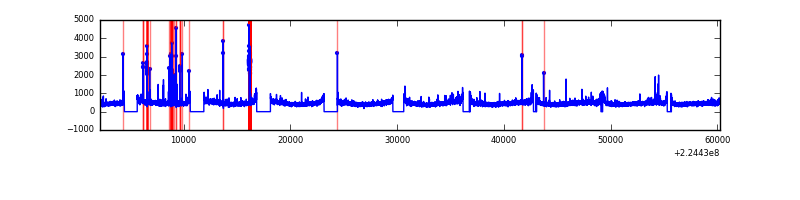 |
| B | 58093 | 50587 | 121 | 121 | 0.21% | 0.24% |  |
| C | 58093 | 50587 | 9 | 9 | 0.02% | 0.02% |  |
| D | 58093 | 50587 | 363 | 363 | 0.62% | 0.72% |  |
Top three noisy pixels from each quadrant. If the there are fewer than three noisy pixels in the level2.evt file, extra rows are filled as -1
| Pixel properties | Quadrant properties | ||||||
|---|---|---|---|---|---|---|---|
| Quadrant | DetID | PixID | Counts | Sigma | Mean | Median | Sigma |
| A | 15 | 234 | 713528 | 584.01 | 6024 | 5899 | 1211.7 |
| A | 4 | 2 | 58878 | 43.72 | 6024 | 5899 | 1211.7 |
| A | 0 | 226 | 58724 | 43.6 | 6024 | 5899 | 1211.7 |
| B | 10 | 245 | 1182151 | 1018.43 | 6100 | 5955 | 1154.9 |
| B | 0 | 214 | 397317 | 338.87 | 6100 | 5955 | 1154.9 |
| B | 4 | 81 | 221729 | 186.83 | 6100 | 5955 | 1154.9 |
| C | 9 | 68 | 6216356 | 4544.3 | 5924 | 5959 | 1366.6 |
| C | 1 | 16 | 52766 | 34.25 | 5924 | 5959 | 1366.6 |
| C | 13 | 61 | 45866 | 29.2 | 5924 | 5959 | 1366.6 |
| D | 2 | 14 | 1242129 | 863.21 | 5897 | 5731 | 1432.3 |
| D | 13 | 169 | 661694 | 457.97 | 5897 | 5731 | 1432.3 |
| D | 2 | 16 | 468109 | 322.82 | 5897 | 5731 | 1432.3 |
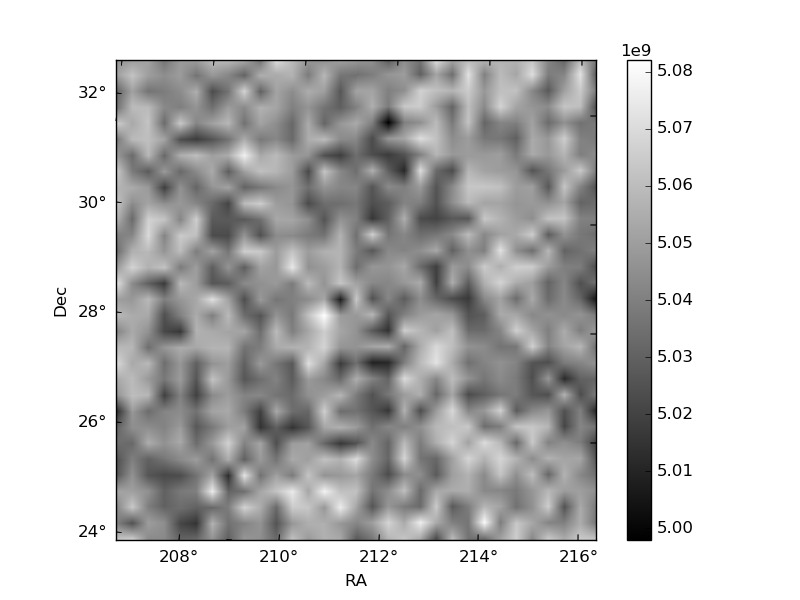
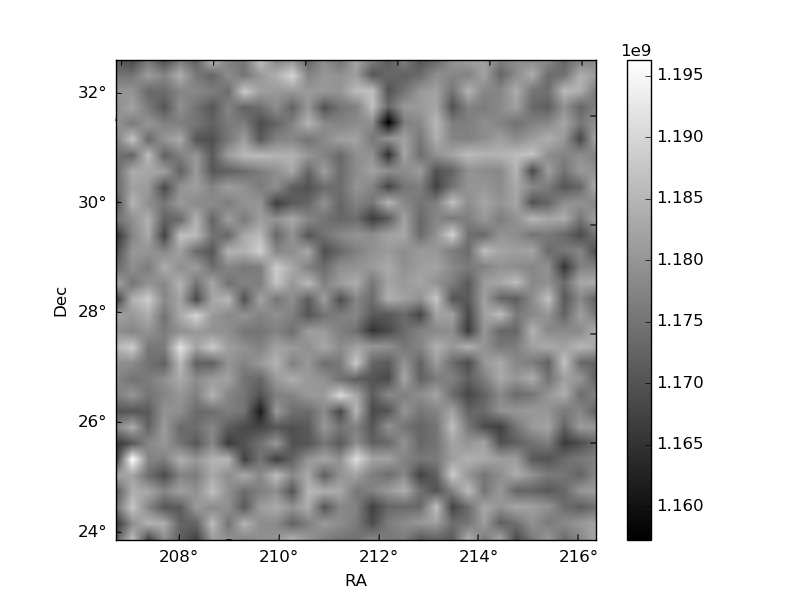
Histogram calculated using DETX and DETY for each event in the final _common_clean file
| Quadrant A | 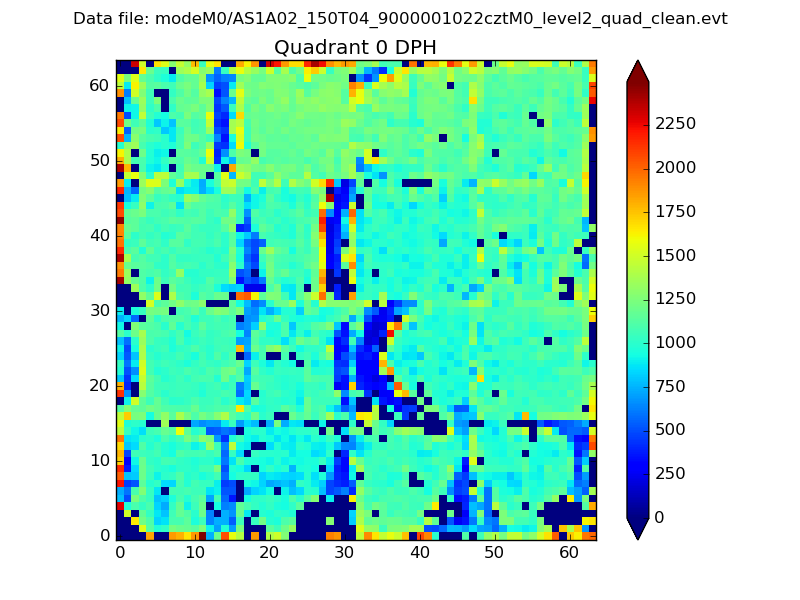 |
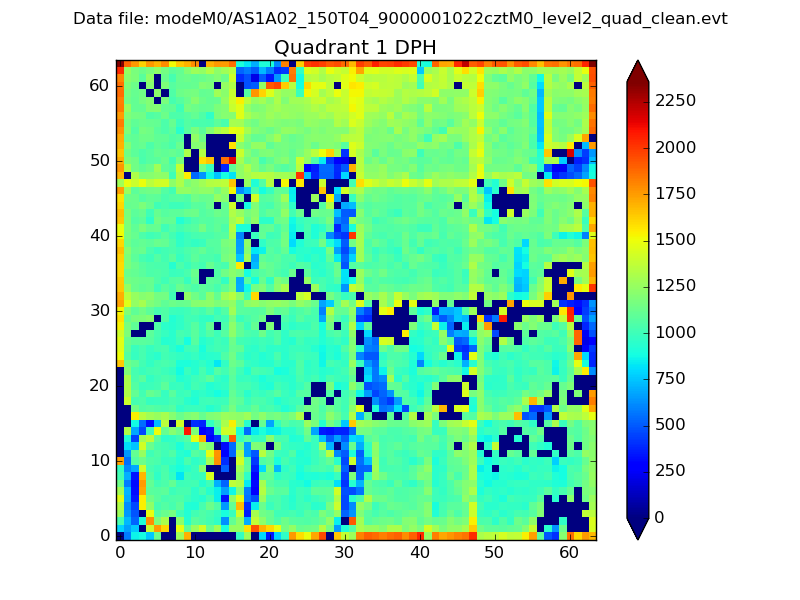 |
Quadrant B |
|---|---|---|---|
| Quadrant D |  |
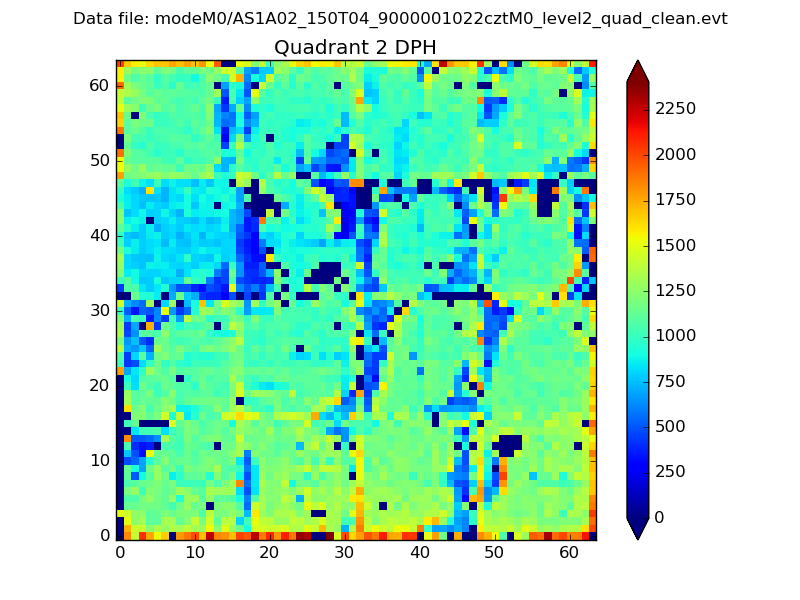 |
Quadrant C |
| Plot type | Count rate plots | Images |
|---|---|---|
| Comparison with Poisson distribution Blue bars denote a histogram of data divided into 1 sec bins. Red curve is a Poisson curve with rate = median count rate of data. |
 |
 |
| Quadrant-wise count rates Data is divided into 100 sec bins |
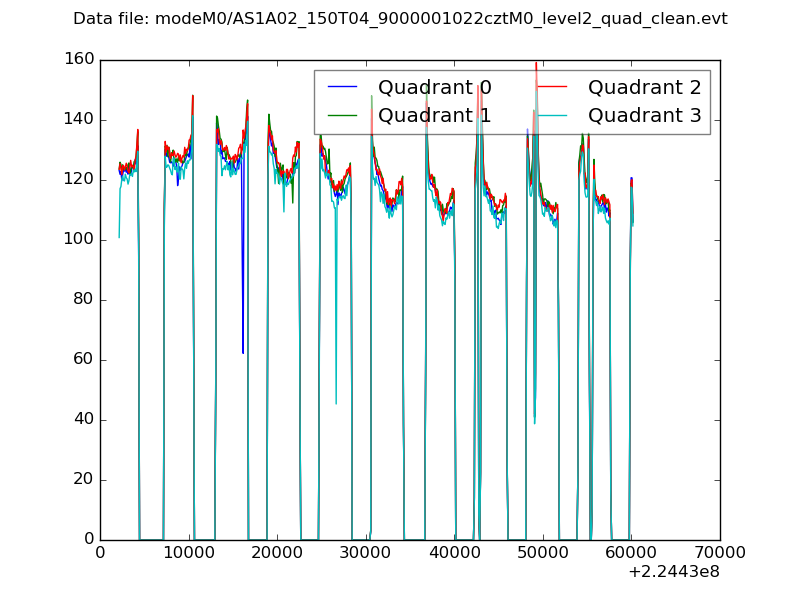 |
|
| Module-wise count rates for Quadrant A Data is divided into 100 sec bins |
 |
 |
| Module-wise count rates for Quadrant B Data is divided into 100 sec bins |
 |
 |
| Module-wise count rates for Quadrant C Data is divided into 100 sec bins |
 |
 |
| Module-wise count rates for Quadrant D Data is divided into 100 sec bins |
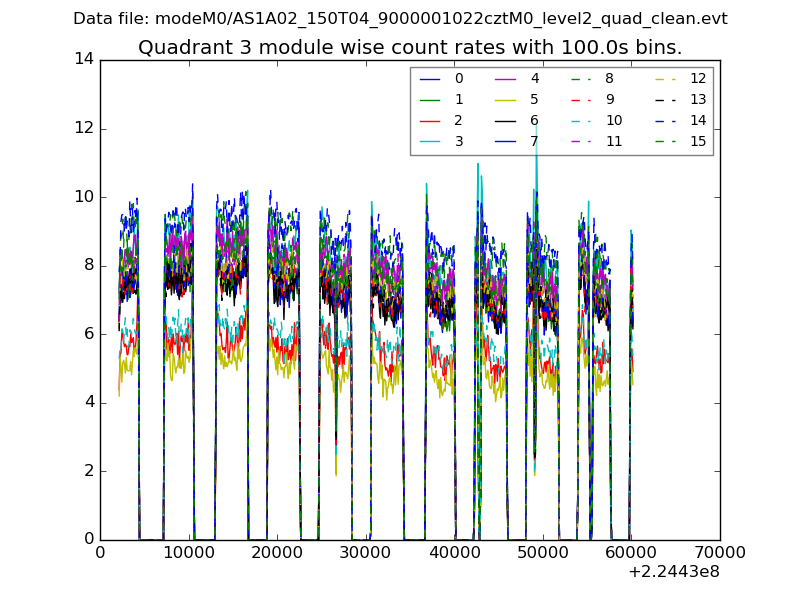 |
 |
| Parameter | Plot |
|---|---|
| CZT HV Monitor |  |
| D_VDD |  |
| Temperature 1 | 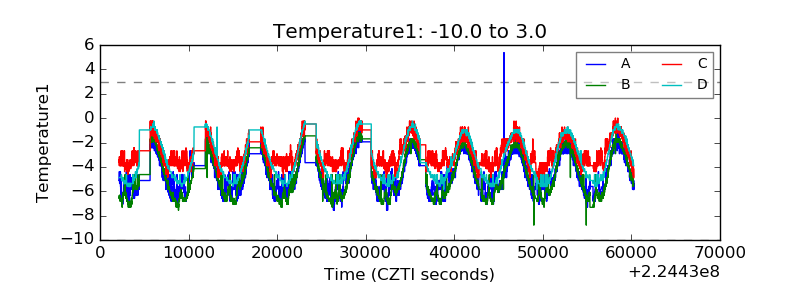 |
| Veto HV Monitor |  |
| Veto LLD |  |
| Alpha Counter |  |
| _CPM_Rate |  |
| CZT Counter | 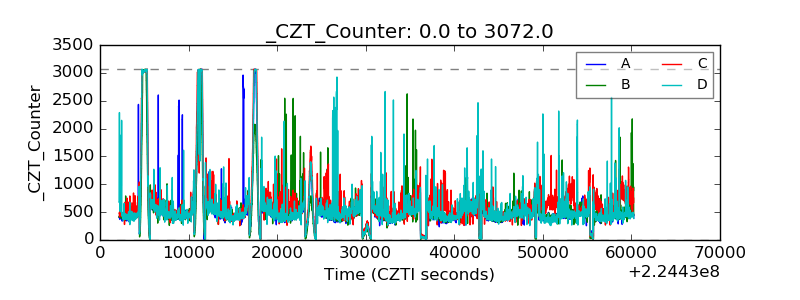 |
| +2.5 Volts monitor |  |
| +5 Volts monitor |  |
| _ROLL_ROT |  |
| _Roll_DEC | 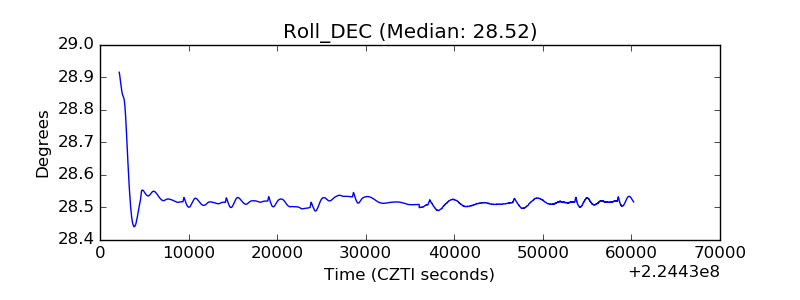 |
| _Roll_RA | 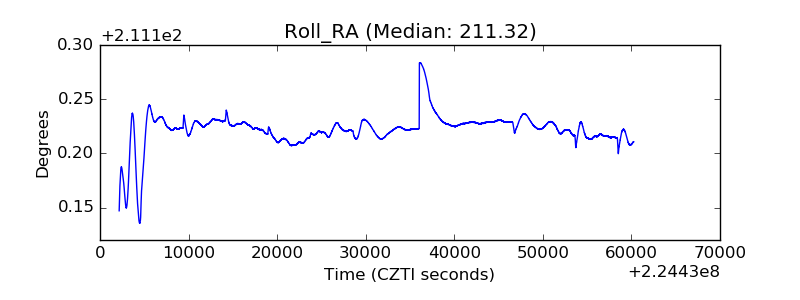 |
| Veto Counter |  |