| Param | Original file | Final file |
|---|---|---|
| Filename | modeM0/AS1G06_138T01_9000001020cztM0_level2.evt | modeM0/AS1G06_138T01_9000001020cztM0_level2_quad_clean.evt |
| Size (bytes) | 2,949,396,480 | 474,451,200 |
| Size | 2.7 GB | 452.5 MB |
| Events in quadrant A | 19,542,981 | 2,865,089 |
| Events in quadrant B | 20,485,729 | 2,936,417 |
| Events in quadrant C | 22,768,893 | 2,892,064 |
| Events in quadrant D | 23,656,512 | 2,758,420 |
| Mode M9 | |||
|---|---|---|---|
| Quadrant | BADHDUFLAG | Total packets | Discarded packets |
| A | 0 | 48 | 0 |
| B | 0 | 48 | 0 |
| C | 0 | 48 | 0 |
| D | 0 | 48 | 0 |
| Mode SS | |||
|---|---|---|---|
| Quadrant | BADHDUFLAG | Total packets | Discarded packets |
| A | 0 | 868 | 0 |
| B | 0 | 868 | 0 |
| C | 0 | 868 | 0 |
| D | 0 | 868 | 0 |
| Mode M0 | |||
|---|---|---|---|
| Quadrant | BADHDUFLAG | Total packets | Discarded packets |
| A | 0 | 87461 | 0 |
| B | 0 | 89048 | 0 |
| C | 0 | 94811 | 0 |
| D | 0 | 99218 | 0 |
| Quadrant | Total seconds | Saturated seconds | Saturation percentage |
|---|---|---|---|
| A | 42494 | 693 | 1.630818% |
| B | 42494 | 758 | 1.783781% |
| C | 42494 | 501 | 1.178990% |
| D | 42493 | 1234 | 2.904008% |
Noise dominated data is calculated using 1-second bins in cleaned event files. If a bin has >2000 counts, and if more than 50% of those come from <1% of pixels, then it is considered to be noise-dominated and hence unusable.
| Quadrant | # 1 sec bins | Bins with >0 counts | Bins with >2000 counts | High rate bins dominated by noise | Noise dominated (total time) | Noise dominated (detector-on time) | Marked lightcurve |
|---|---|---|---|---|---|---|---|
| A | 51162 | 42504 | 4 | 4 | 0.01% | 0.01% | 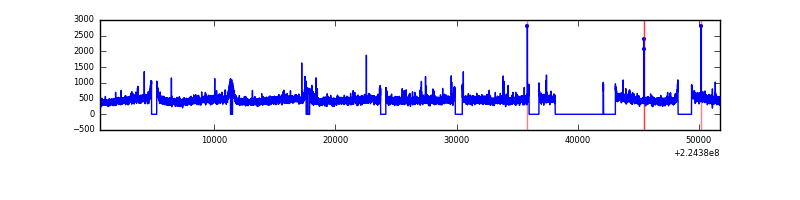 |
| B | 51162 | 42504 | 22 | 22 | 0.04% | 0.05% |  |
| C | 51162 | 42505 | 7 | 7 | 0.01% | 0.02% |  |
| D | 51162 | 42503 | 521 | 521 | 1.02% | 1.23% |  |
Top three noisy pixels from each quadrant. If the there are fewer than three noisy pixels in the level2.evt file, extra rows are filled as -1
| Pixel properties | Quadrant properties | ||||||
|---|---|---|---|---|---|---|---|
| Quadrant | DetID | PixID | Counts | Sigma | Mean | Median | Sigma |
| A | 13 | 251 | 61304 | 55.24 | 5039 | 4932 | 1020.5 |
| A | 0 | 226 | 48807 | 42.99 | 5039 | 4932 | 1020.5 |
| A | 12 | 194 | 44280 | 38.56 | 5039 | 4932 | 1020.5 |
| B | 0 | 214 | 502908 | 511.32 | 5082 | 4954 | 973.9 |
| B | 12 | 111 | 101373 | 99.01 | 5082 | 4954 | 973.9 |
| B | 4 | 81 | 88783 | 86.08 | 5082 | 4954 | 973.9 |
| C | 9 | 68 | 3475899 | 3046.26 | 4904 | 4925 | 1139.4 |
| C | 1 | 16 | 62252 | 50.31 | 4904 | 4925 | 1139.4 |
| C | 12 | 4 | 48189 | 37.97 | 4904 | 4925 | 1139.4 |
| D | 8 | 195 | 999669 | 832.64 | 4879 | 4726 | 1194.9 |
| D | 2 | 14 | 898143 | 747.67 | 4879 | 4726 | 1194.9 |
| D | 13 | 104 | 666914 | 554.16 | 4879 | 4726 | 1194.9 |
Histogram calculated using DETX and DETY for each event in the final _common_clean file
| Quadrant A | 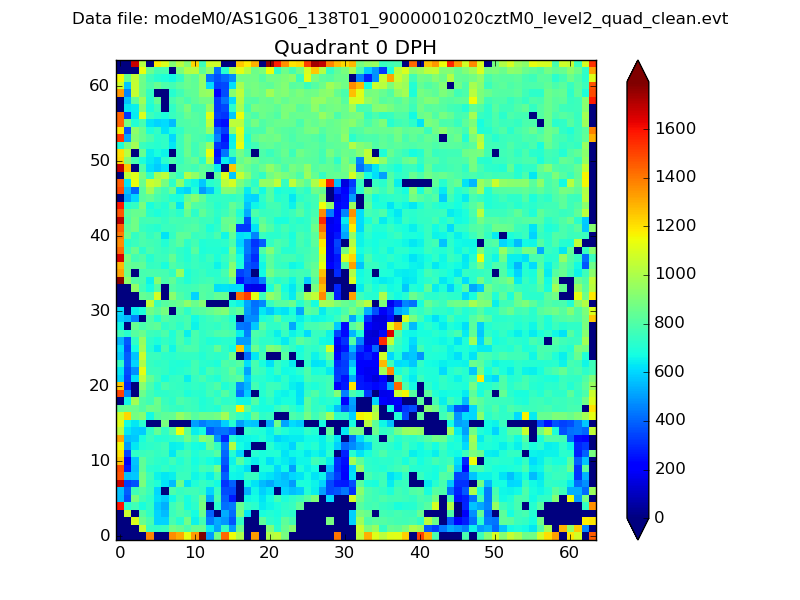 |
 |
Quadrant B |
|---|---|---|---|
| Quadrant D |  |
 |
Quadrant C |
| Plot type | Count rate plots | Images |
|---|---|---|
| Comparison with Poisson distribution Blue bars denote a histogram of data divided into 1 sec bins. Red curve is a Poisson curve with rate = median count rate of data. |
 |
 |
| Quadrant-wise count rates Data is divided into 100 sec bins |
 |
|
| Module-wise count rates for Quadrant A Data is divided into 100 sec bins |
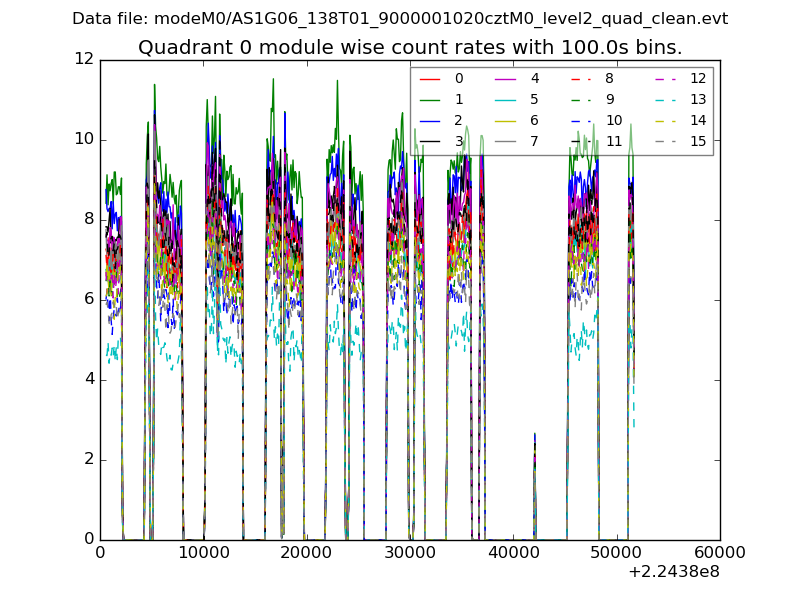 |
 |
| Module-wise count rates for Quadrant B Data is divided into 100 sec bins |
 |
 |
| Module-wise count rates for Quadrant C Data is divided into 100 sec bins |
 |
 |
| Module-wise count rates for Quadrant D Data is divided into 100 sec bins |
 |
 |
| Parameter | Plot |
|---|---|
| CZT HV Monitor |  |
| D_VDD | 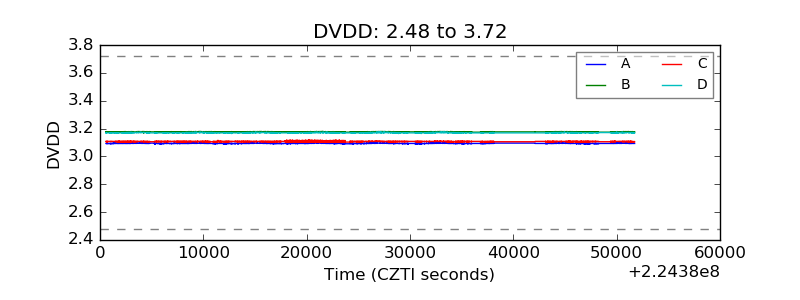 |
| Temperature 1 |  |
| Veto HV Monitor | 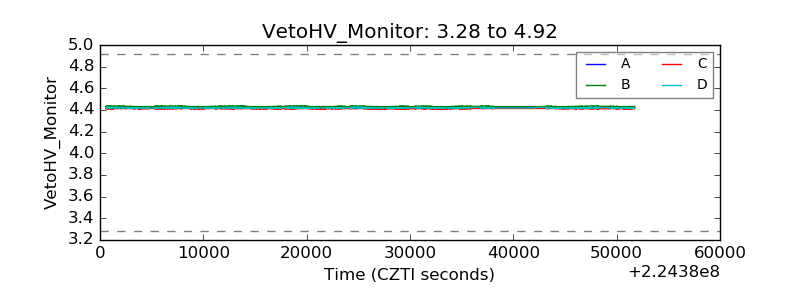 |
| Veto LLD | 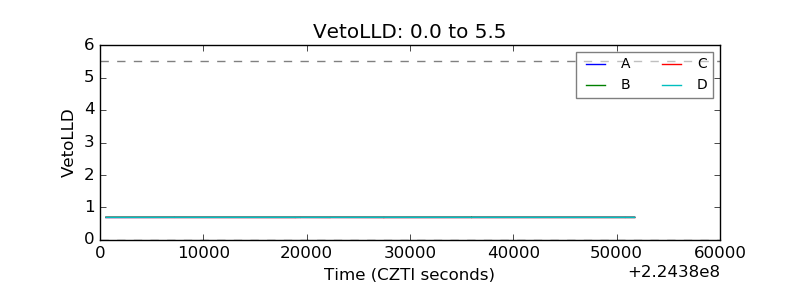 |
| Alpha Counter |  |
| _CPM_Rate |  |
| CZT Counter | 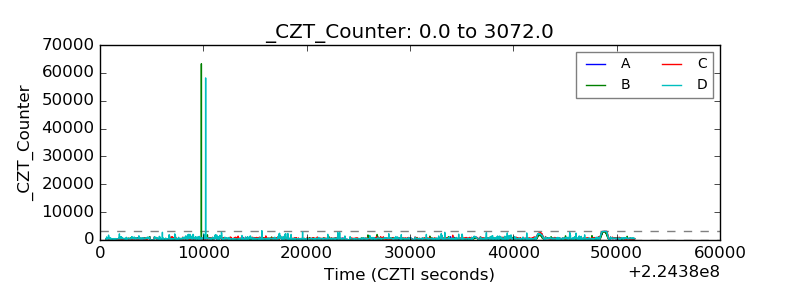 |
| +2.5 Volts monitor |  |
| +5 Volts monitor |  |
| _ROLL_ROT |  |
| _Roll_DEC |  |
| _Roll_RA |  |
| Veto Counter |  |