| Param | Original file | Final file |
|---|---|---|
| Filename | modeM0/AS1G06_087T02_9000001016cztM0_level2.evt | modeM0/AS1G06_087T02_9000001016cztM0_level2_quad_clean.evt |
| Size (bytes) | 1,375,205,760 | 242,228,160 |
| Size | 1.3 GB | 231.0 MB |
| Events in quadrant A | 9,535,283 | 1,472,445 |
| Events in quadrant B | 9,939,399 | 1,506,657 |
| Events in quadrant C | 9,443,613 | 1,499,197 |
| Events in quadrant D | 11,318,827 | 1,421,456 |
| Mode M9 | |||
|---|---|---|---|
| Quadrant | BADHDUFLAG | Total packets | Discarded packets |
| A | 0 | 14 | 0 |
| B | 0 | 14 | 0 |
| C | 0 | 14 | 0 |
| D | 0 | 14 | 0 |
| Mode SS | |||
|---|---|---|---|
| Quadrant | BADHDUFLAG | Total packets | Discarded packets |
| A | 0 | 426 | 0 |
| B | 0 | 426 | 0 |
| C | 0 | 426 | 0 |
| D | 0 | 426 | 0 |
| Mode M0 | |||
|---|---|---|---|
| Quadrant | BADHDUFLAG | Total packets | Discarded packets |
| A | 0 | 42832 | 0 |
| B | 0 | 43461 | 0 |
| C | 0 | 42859 | 0 |
| D | 0 | 48314 | 0 |
| Quadrant | Total seconds | Saturated seconds | Saturation percentage |
|---|---|---|---|
| A | 20864 | 282 | 1.351610% |
| B | 20864 | 331 | 1.586465% |
| C | 20864 | 162 | 0.776457% |
| D | 20863 | 450 | 2.156929% |
Noise dominated data is calculated using 1-second bins in cleaned event files. If a bin has >2000 counts, and if more than 50% of those come from <1% of pixels, then it is considered to be noise-dominated and hence unusable.
| Quadrant | # 1 sec bins | Bins with >0 counts | Bins with >2000 counts | High rate bins dominated by noise | Noise dominated (total time) | Noise dominated (detector-on time) | Marked lightcurve |
|---|---|---|---|---|---|---|---|
| A | 22206 | 20870 | 0 | 0 | 0.00% | 0.00% |  |
| B | 22206 | 20870 | 16 | 16 | 0.07% | 0.08% |  |
| C | 22206 | 20870 | 11 | 11 | 0.05% | 0.05% |  |
| D | 22206 | 20868 | 221 | 221 | 1.00% | 1.06% |  |
Top three noisy pixels from each quadrant. If the there are fewer than three noisy pixels in the level2.evt file, extra rows are filled as -1
| Pixel properties | Quadrant properties | ||||||
|---|---|---|---|---|---|---|---|
| Quadrant | DetID | PixID | Counts | Sigma | Mean | Median | Sigma |
| A | 3 | 1 | 40692 | 76.22 | 2456 | 2397 | 502.4 |
| A | 0 | 226 | 23939 | 42.88 | 2456 | 2397 | 502.4 |
| A | 12 | 194 | 22362 | 39.74 | 2456 | 2397 | 502.4 |
| B | 0 | 214 | 259664 | 537.98 | 2477 | 2413 | 478.2 |
| B | 12 | 111 | 49261 | 97.97 | 2477 | 2413 | 478.2 |
| B | 11 | 111 | 39364 | 77.27 | 2477 | 2413 | 478.2 |
| C | 8 | 128 | 35634 | 59.43 | 2393 | 2396 | 559.2 |
| C | 9 | 68 | 27473 | 44.84 | 2393 | 2396 | 559.2 |
| C | 13 | 61 | 18907 | 29.52 | 2393 | 2396 | 559.2 |
| D | 2 | 216 | 678087 | 1160.4 | 2373 | 2297 | 582.4 |
| D | 13 | 105 | 485406 | 829.54 | 2373 | 2297 | 582.4 |
| D | 12 | 233 | 457779 | 782.11 | 2373 | 2297 | 582.4 |
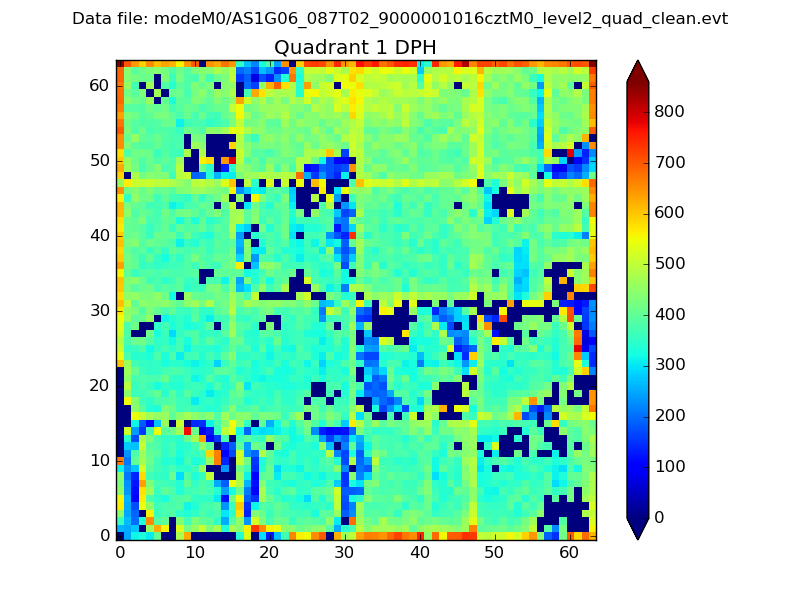
Histogram calculated using DETX and DETY for each event in the final _common_clean file
| Quadrant A |  |
 |
Quadrant B |
|---|---|---|---|
| Quadrant D |  |
 |
Quadrant C |
| Plot type | Count rate plots | Images |
|---|---|---|
| Comparison with Poisson distribution Blue bars denote a histogram of data divided into 1 sec bins. Red curve is a Poisson curve with rate = median count rate of data. |
 |
 |
| Quadrant-wise count rates Data is divided into 100 sec bins |
 |
|
| Module-wise count rates for Quadrant A Data is divided into 100 sec bins |
 |
 |
| Module-wise count rates for Quadrant B Data is divided into 100 sec bins |
 |
 |
| Module-wise count rates for Quadrant C Data is divided into 100 sec bins |
 |
 |
| Module-wise count rates for Quadrant D Data is divided into 100 sec bins |
 |
 |
| Parameter | Plot |
|---|---|
| CZT HV Monitor |  |
| D_VDD |  |
| Temperature 1 |  |
| Veto HV Monitor | 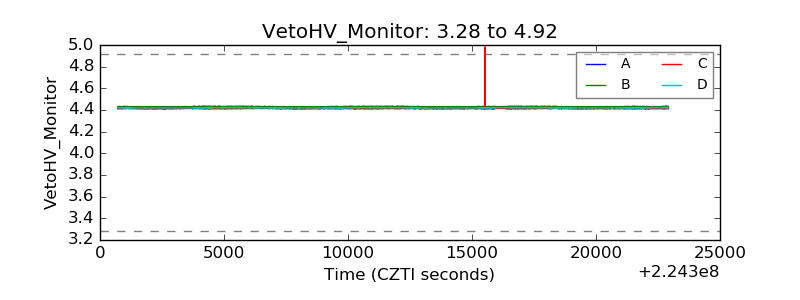 |
| Veto LLD |  |
| Alpha Counter |  |
| _CPM_Rate |  |
| CZT Counter |  |
| +2.5 Volts monitor |  |
| +5 Volts monitor |  |
| _ROLL_ROT |  |
| _Roll_DEC |  |
| _Roll_RA |  |
| Veto Counter |  |