| Param | Original file | Final file |
|---|---|---|
| Filename | modeM0/AS1A02_150T03_9000001018cztM0_level2.evt | modeM0/AS1A02_150T03_9000001018cztM0_level2_quad_clean.evt |
| Size (bytes) | 1,288,350,720 | 232,372,800 |
| Size | 1.2 GB | 221.6 MB |
| Events in quadrant A | 7,715,201 | 1,548,773 |
| Events in quadrant B | 8,156,666 | 1,580,793 |
| Events in quadrant C | 7,538,566 | 1,541,449 |
| Events in quadrant D | 14,493,594 | 1,230,119 |
| Mode SS | |||
|---|---|---|---|
| Quadrant | BADHDUFLAG | Total packets | Discarded packets |
| A | 0 | 332 | 0 |
| B | 0 | 332 | 0 |
| C | 0 | 332 | 0 |
| D | 0 | 332 | 0 |
| Mode M0 | |||
|---|---|---|---|
| Quadrant | BADHDUFLAG | Total packets | Discarded packets |
| A | 0 | 34227 | 0 |
| B | 0 | 35332 | 0 |
| C | 0 | 33900 | 0 |
| D | 0 | 54582 | 0 |
| Mode M9 | |||
|---|---|---|---|
| Quadrant | BADHDUFLAG | Total packets | Discarded packets |
| A | 1 | 251318637792 | 0 |
| B | 1 | 251318637792 | 0 |
| C | 1 | 251318637792 | 0 |
| D | 1 | 251318637792 | 0 |
| Quadrant | Total seconds | Saturated seconds | Saturation percentage |
|---|---|---|---|
| A | 16486 | 121 | 0.733956% |
| B | 16487 | 188 | 1.140292% |
| C | 16482 | 66 | 0.400437% |
| D | 16483 | 2784 | 16.890129% |
Noise dominated data is calculated using 1-second bins in cleaned event files. If a bin has >2000 counts, and if more than 50% of those come from <1% of pixels, then it is considered to be noise-dominated and hence unusable.
| Quadrant | # 1 sec bins | Bins with >0 counts | Bins with >2000 counts | High rate bins dominated by noise | Noise dominated (total time) | Noise dominated (detector-on time) | Marked lightcurve |
|---|---|---|---|---|---|---|---|
| A | 36861 | 16501 | 1 | 1 | 0.00% | 0.01% |  |
| B | 36862 | 16504 | 11 | 11 | 0.03% | 0.07% |  |
| C | 36862 | 16497 | 2 | 2 | 0.01% | 0.01% |  |
| D | 36862 | 16495 | 2575 | 2575 | 6.99% | 15.61% | 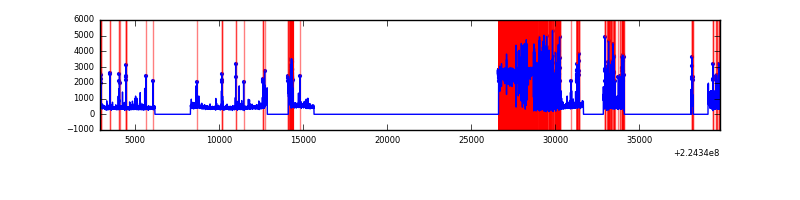 |
Top three noisy pixels from each quadrant. If the there are fewer than three noisy pixels in the level2.evt file, extra rows are filled as -1
| Pixel properties | Quadrant properties | ||||||
|---|---|---|---|---|---|---|---|
| Quadrant | DetID | PixID | Counts | Sigma | Mean | Median | Sigma |
| A | 3 | 1 | 54097 | 131.18 | 1979 | 1943 | 397.6 |
| A | 0 | 226 | 19241 | 43.51 | 1979 | 1943 | 397.6 |
| A | 13 | 248 | 19181 | 43.36 | 1979 | 1943 | 397.6 |
| B | 11 | 51 | 126160 | 328.34 | 2007 | 1958 | 378.3 |
| B | 0 | 214 | 112742 | 292.86 | 2007 | 1958 | 378.3 |
| B | 0 | 187 | 68102 | 174.85 | 2007 | 1958 | 378.3 |
| C | 1 | 16 | 28920 | 60.78 | 1922 | 1933 | 444.0 |
| C | 13 | 61 | 15008 | 29.45 | 1922 | 1933 | 444.0 |
| C | 12 | 4 | 12180 | 23.08 | 1922 | 1933 | 444.0 |
| D | 13 | 105 | 7046805 | 17188.92 | 1675 | 1624 | 409.9 |
| D | 5 | 233 | 250345 | 606.83 | 1675 | 1624 | 409.9 |
| D | 2 | 216 | 193266 | 467.57 | 1675 | 1624 | 409.9 |
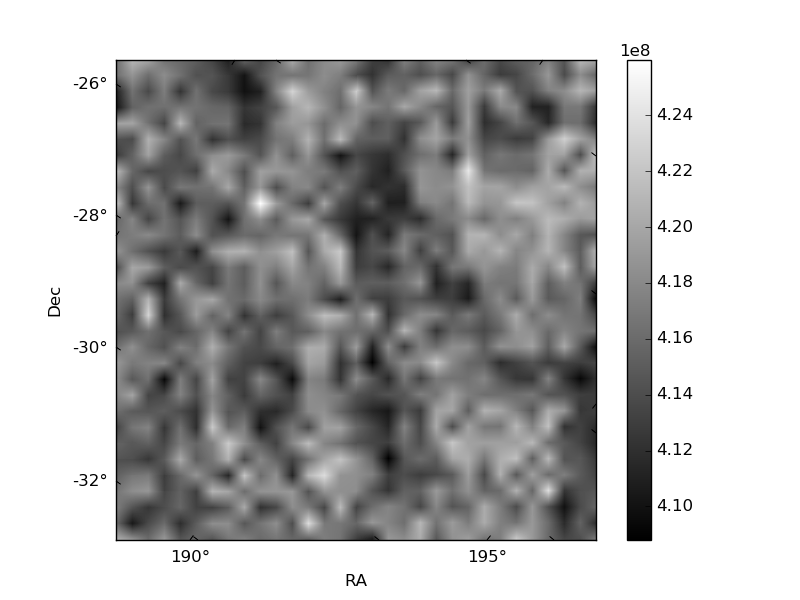
Histogram calculated using DETX and DETY for each event in the final _common_clean file
| Quadrant A | 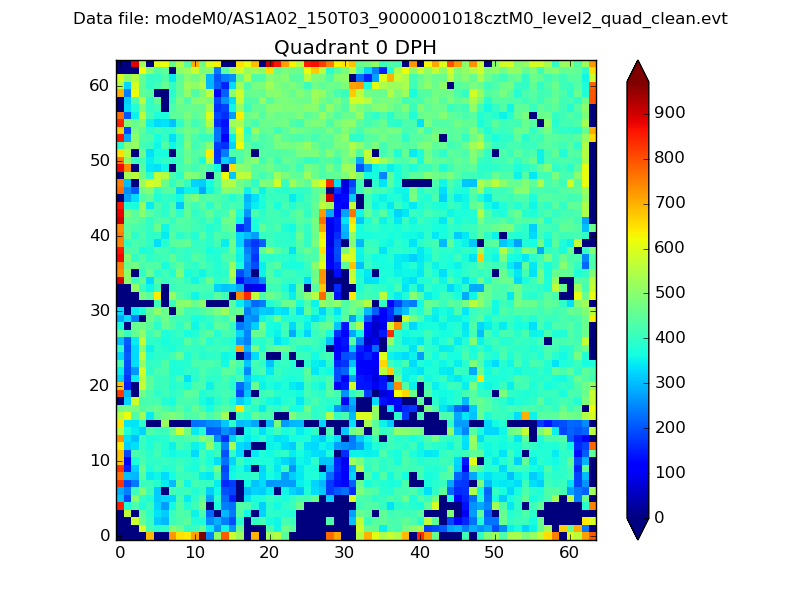 |
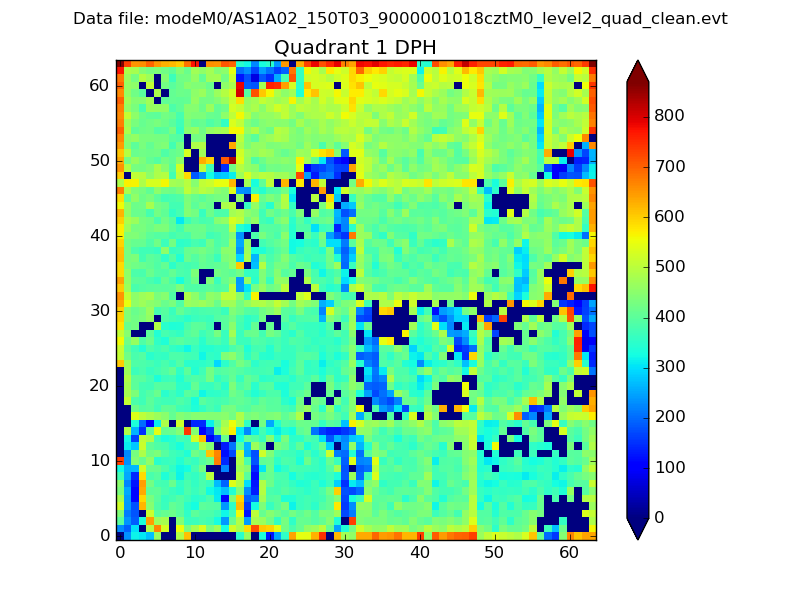 |
Quadrant B |
|---|---|---|---|
| Quadrant D | 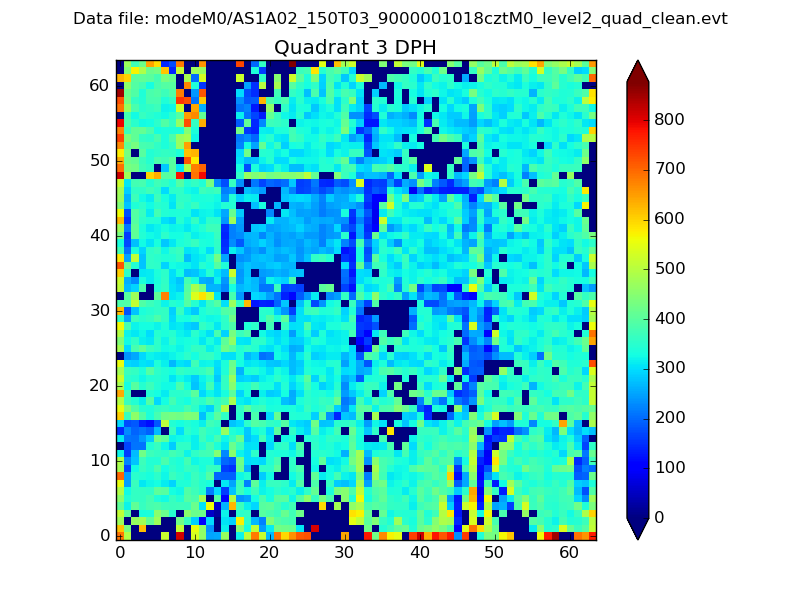 |
 |
Quadrant C |
| Plot type | Count rate plots | Images |
|---|---|---|
| Comparison with Poisson distribution Blue bars denote a histogram of data divided into 1 sec bins. Red curve is a Poisson curve with rate = median count rate of data. |
 |
 |
| Quadrant-wise count rates Data is divided into 100 sec bins |
 |
|
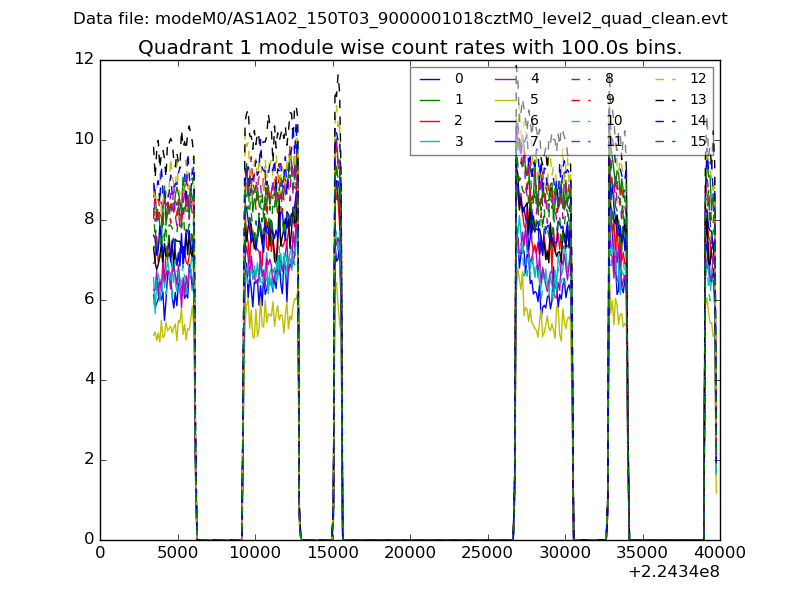
| Module-wise count rates for Quadrant A Data is divided into 100 sec bins |
 |
 |
| Module-wise count rates for Quadrant B Data is divided into 100 sec bins |
 |
 |
| Module-wise count rates for Quadrant C Data is divided into 100 sec bins |
 |
 |
| Module-wise count rates for Quadrant D Data is divided into 100 sec bins |
 |
 |
| Parameter | Plot |
|---|---|
| CZT HV Monitor |  |
| D_VDD |  |
| Temperature 1 |  |
| Veto HV Monitor |  |
| Veto LLD |  |
| Alpha Counter |  |
| _CPM_Rate | 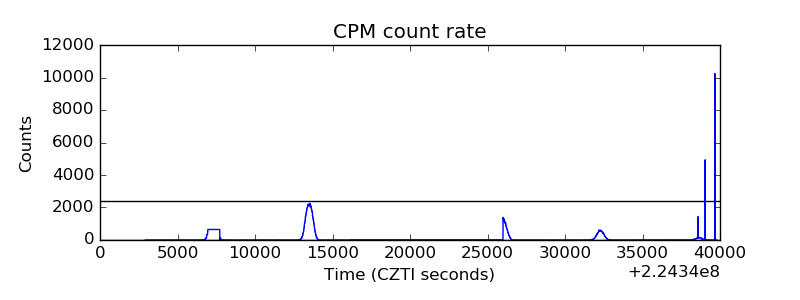 |
| CZT Counter |  |
| +2.5 Volts monitor |  |
| +5 Volts monitor | 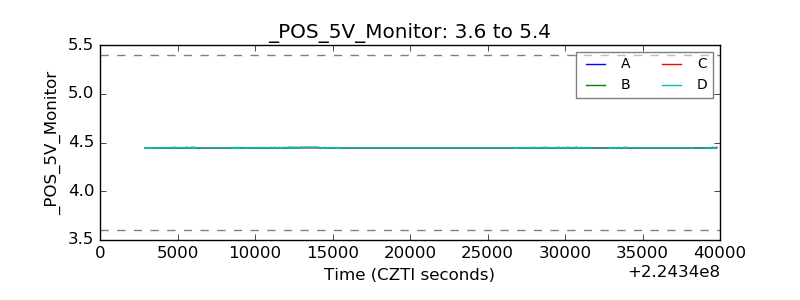 |
| _ROLL_ROT |  |
| _Roll_DEC |  |
| _Roll_RA |  |
| Veto Counter |  |