| Param | Original file | Final file |
|---|---|---|
| Filename | modeM0/AS1A02_031T01_9000001014cztM0_level2.evt | modeM0/AS1A02_031T01_9000001014cztM0_level2_quad_clean.evt |
| Size (bytes) | 704,188,800 | 147,098,880 |
| Size | 671.6 MB | 140.3 MB |
| Events in quadrant A | 4,813,996 | 929,092 |
| Events in quadrant B | 5,262,936 | 952,989 |
| Events in quadrant C | 4,779,460 | 947,236 |
| Events in quadrant D | 5,757,441 | 897,957 |
| Mode M9 | |||
|---|---|---|---|
| Quadrant | BADHDUFLAG | Total packets | Discarded packets |
| A | 0 | 18 | 0 |
| B | 0 | 18 | 0 |
| C | 0 | 18 | 0 |
| D | 0 | 20 | 0 |
| Mode SS | |||
|---|---|---|---|
| Quadrant | BADHDUFLAG | Total packets | Discarded packets |
| A | 0 | 212 | 0 |
| B | 0 | 212 | 0 |
| C | 0 | 212 | 0 |
| D | 0 | 212 | 0 |
| Mode M0 | |||
|---|---|---|---|
| Quadrant | BADHDUFLAG | Total packets | Discarded packets |
| A | 0 | 21791 | 0 |
| B | 0 | 22904 | 0 |
| C | 0 | 21673 | 0 |
| D | 0 | 24631 | 0 |
| Quadrant | Total seconds | Saturated seconds | Saturation percentage |
|---|---|---|---|
| A | 10523 | 56 | 0.532168% |
| B | 10507 | 87 | 0.828019% |
| C | 10514 | 31 | 0.294845% |
| D | 10513 | 110 | 1.046324% |
Noise dominated data is calculated using 1-second bins in cleaned event files. If a bin has >2000 counts, and if more than 50% of those come from <1% of pixels, then it is considered to be noise-dominated and hence unusable.
| Quadrant | # 1 sec bins | Bins with >0 counts | Bins with >2000 counts | High rate bins dominated by noise | Noise dominated (total time) | Noise dominated (detector-on time) | Marked lightcurve |
|---|---|---|---|---|---|---|---|
| A | 21361 | 10538 | 1 | 1 | 0.00% | 0.01% |  |
| B | 21361 | 10528 | 7 | 7 | 0.03% | 0.07% |  |
| C | 21361 | 10532 | 0 | 0 | 0.00% | 0.00% |  |
| D | 21361 | 10533 | 64 | 64 | 0.30% | 0.61% |  |
Top three noisy pixels from each quadrant. If the there are fewer than three noisy pixels in the level2.evt file, extra rows are filled as -1
| Pixel properties | Quadrant properties | ||||||
|---|---|---|---|---|---|---|---|
| Quadrant | DetID | PixID | Counts | Sigma | Mean | Median | Sigma |
| A | 4 | 2 | 62029 | 240.9 | 1228 | 1200 | 252.5 |
| A | 0 | 226 | 11871 | 42.26 | 1228 | 1200 | 252.5 |
| A | 15 | 234 | 11703 | 41.59 | 1228 | 1200 | 252.5 |
| B | 10 | 252 | 272825 | 1147.2 | 1249 | 1220 | 236.8 |
| B | 0 | 214 | 77305 | 321.37 | 1249 | 1220 | 236.8 |
| B | 4 | 170 | 31698 | 128.73 | 1249 | 1220 | 236.8 |
| C | 1 | 16 | 20997 | 70.11 | 1211 | 1220 | 282.1 |
| C | 8 | 229 | 16722 | 54.95 | 1211 | 1220 | 282.1 |
| C | 12 | 4 | 9887 | 30.72 | 1211 | 1220 | 282.1 |
| D | 2 | 216 | 650095 | 2193.29 | 1196 | 1160 | 295.9 |
| D | 12 | 233 | 192562 | 646.91 | 1196 | 1160 | 295.9 |
| D | 1 | 52 | 143899 | 482.43 | 1196 | 1160 | 295.9 |
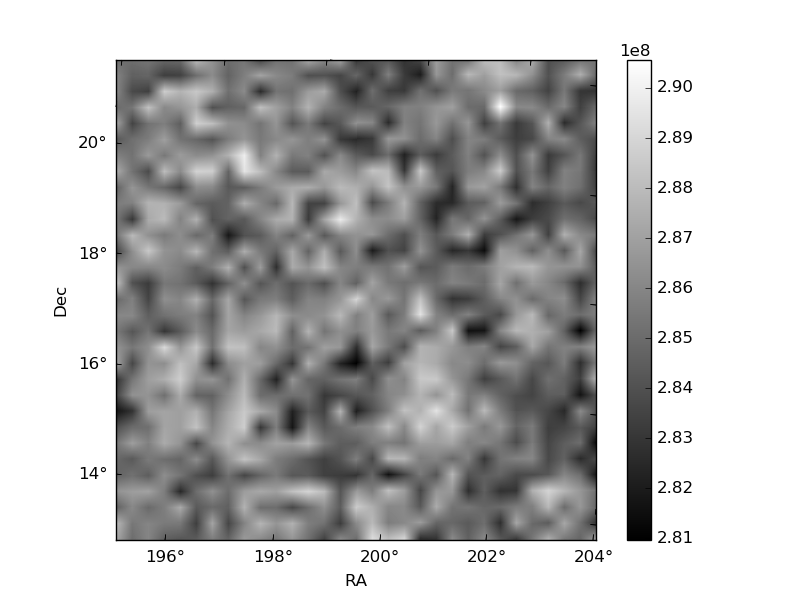
Histogram calculated using DETX and DETY for each event in the final _common_clean file
| Quadrant A |  |
 |
Quadrant B |
|---|---|---|---|
| Quadrant D |  |
 |
Quadrant C |
| Plot type | Count rate plots | Images |
|---|---|---|
| Comparison with Poisson distribution Blue bars denote a histogram of data divided into 1 sec bins. Red curve is a Poisson curve with rate = median count rate of data. |
 |
 |
| Quadrant-wise count rates Data is divided into 100 sec bins |
 |
|
| Module-wise count rates for Quadrant A Data is divided into 100 sec bins |
 |
 |
| Module-wise count rates for Quadrant B Data is divided into 100 sec bins |
 |
 |
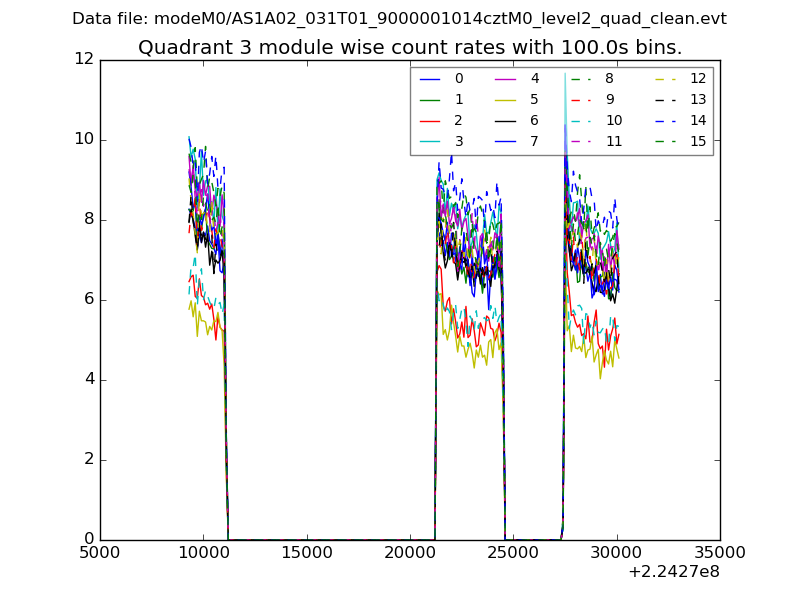
| Module-wise count rates for Quadrant C Data is divided into 100 sec bins |
 |
 |
| Module-wise count rates for Quadrant D Data is divided into 100 sec bins |
 |
 |
| Parameter | Plot |
|---|---|
| CZT HV Monitor | 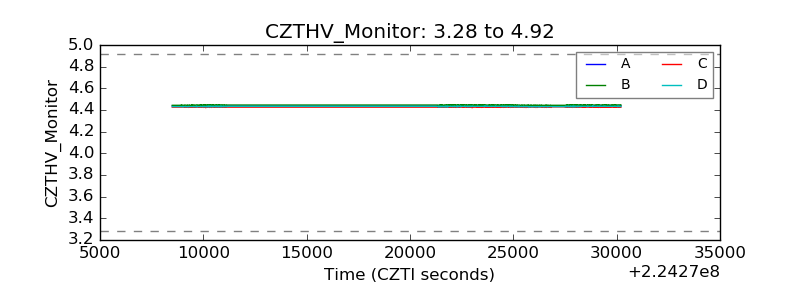 |
| D_VDD |  |
| Temperature 1 |  |
| Veto HV Monitor | 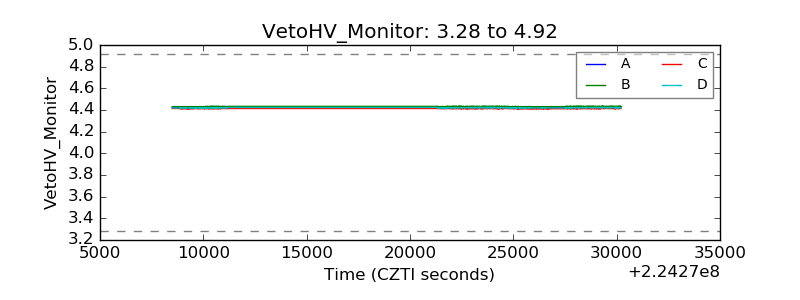 |
| Veto LLD |  |
| Alpha Counter |  |
| _CPM_Rate |  |
| CZT Counter |  |
| +2.5 Volts monitor | 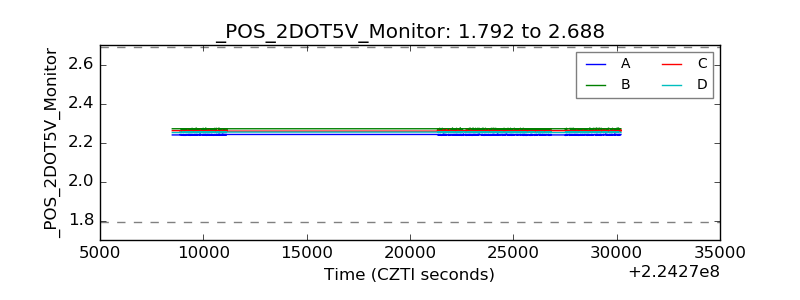 |
| +5 Volts monitor | 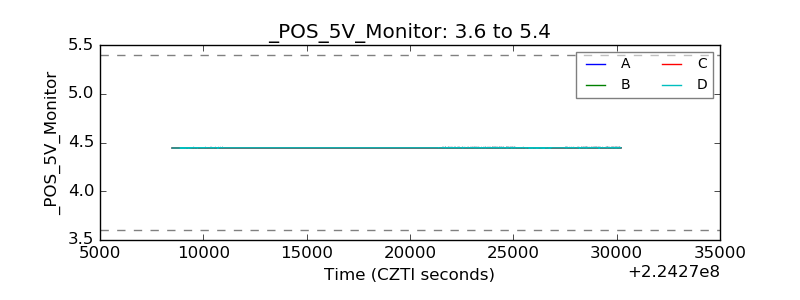 |
| _ROLL_ROT |  |
| _Roll_DEC |  |
| _Roll_RA |  |
| Veto Counter | 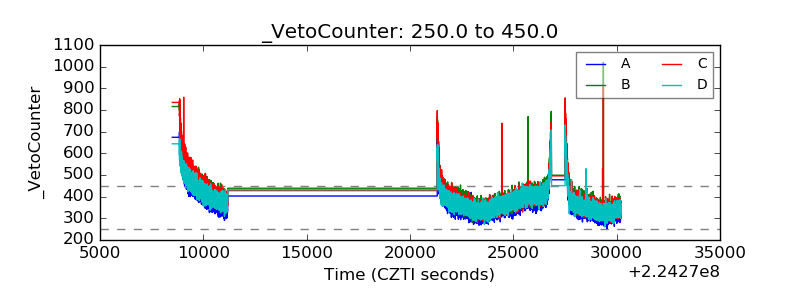 |