| Param | Original file | Final file |
|---|---|---|
| Filename | modeM0/AS1G06_117T01_9000001012cztM0_level2.evt | modeM0/AS1G06_117T01_9000001012cztM0_level2_quad_clean.evt |
| Size (bytes) | 3,083,302,080 | 547,156,800 |
| Size | 2.9 GB | 521.8 MB |
| Events in quadrant A | 24,166,079 | 3,344,915 |
| Events in quadrant B | 21,098,645 | 3,510,051 |
| Events in quadrant C | 19,825,582 | 3,506,330 |
| Events in quadrant D | 25,417,178 | 3,290,857 |
| Mode M9 | |||
|---|---|---|---|
| Quadrant | BADHDUFLAG | Total packets | Discarded packets |
| A | 0 | 89 | 0 |
| B | 0 | 89 | 0 |
| C | 0 | 89 | 0 |
| D | 0 | 91 | 0 |
| Mode M0 | |||
|---|---|---|---|
| Quadrant | BADHDUFLAG | Total packets | Discarded packets |
| A | 0 | 100866 | 0 |
| B | 0 | 91636 | 0 |
| C | 0 | 88582 | 0 |
| D | 0 | 105730 | 0 |
| Mode SS | |||
|---|---|---|---|
| Quadrant | BADHDUFLAG | Total packets | Discarded packets |
| A | 0 | 862 | 0 |
| B | 0 | 864 | 0 |
| C | 0 | 864 | 0 |
| D | 0 | 864 | 0 |
| Quadrant | Total seconds | Saturated seconds | Saturation percentage |
|---|---|---|---|
| A | 42546 | 1577 | 3.706576% |
| B | 42543 | 507 | 1.191735% |
| C | 42551 | 425 | 0.998801% |
| D | 42546 | 1620 | 3.807643% |
Noise dominated data is calculated using 1-second bins in cleaned event files. If a bin has >2000 counts, and if more than 50% of those come from <1% of pixels, then it is considered to be noise-dominated and hence unusable.
| Quadrant | # 1 sec bins | Bins with >0 counts | Bins with >2000 counts | High rate bins dominated by noise | Noise dominated (total time) | Noise dominated (detector-on time) | Marked lightcurve |
|---|---|---|---|---|---|---|---|
| A | 83013 | 42572 | 826 | 826 | 1.00% | 1.94% | 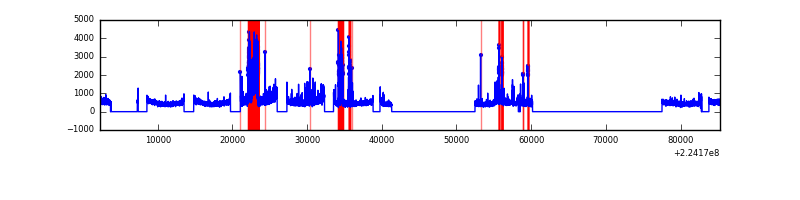 |
| B | 83013 | 42570 | 19 | 19 | 0.02% | 0.04% |  |
| C | 83013 | 42573 | 67 | 67 | 0.08% | 0.16% |  |
| D | 83013 | 42568 | 780 | 780 | 0.94% | 1.83% |  |
Top three noisy pixels from each quadrant. If the there are fewer than three noisy pixels in the level2.evt file, extra rows are filled as -1
| Pixel properties | Quadrant properties | ||||||
|---|---|---|---|---|---|---|---|
| Quadrant | DetID | PixID | Counts | Sigma | Mean | Median | Sigma |
| A | 15 | 239 | 3583116 | 3539.12 | 5031 | 4923 | 1011.0 |
| A | 14 | 111 | 557466 | 546.51 | 5031 | 4923 | 1011.0 |
| A | 15 | 234 | 322640 | 314.25 | 5031 | 4923 | 1011.0 |
| B | 0 | 187 | 488480 | 497.8 | 5154 | 5042 | 971.1 |
| B | 0 | 214 | 398380 | 405.03 | 5154 | 5042 | 971.1 |
| B | 4 | 81 | 130025 | 128.7 | 5154 | 5042 | 971.1 |
| C | 9 | 68 | 213106 | 180.94 | 5002 | 5030 | 1149.9 |
| C | 1 | 16 | 79643 | 64.88 | 5002 | 5030 | 1149.9 |
| C | 13 | 61 | 39044 | 29.58 | 5002 | 5030 | 1149.9 |
| D | 13 | 137 | 2831992 | 2367.67 | 4915 | 4771 | 1194.1 |
| D | 2 | 216 | 1954659 | 1632.94 | 4915 | 4771 | 1194.1 |
| D | 14 | 34 | 646116 | 537.1 | 4915 | 4771 | 1194.1 |
Histogram calculated using DETX and DETY for each event in the final _common_clean file
| Quadrant A |  |
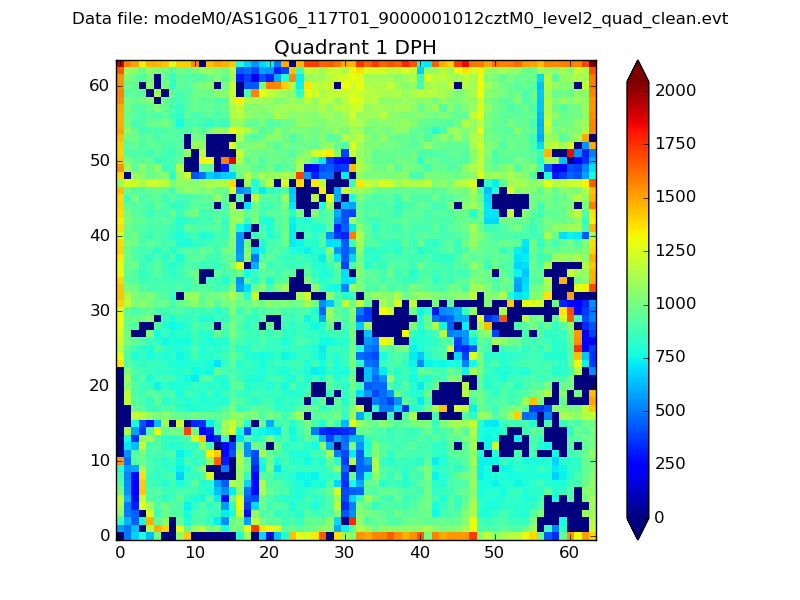 |
Quadrant B |
|---|---|---|---|
| Quadrant D | 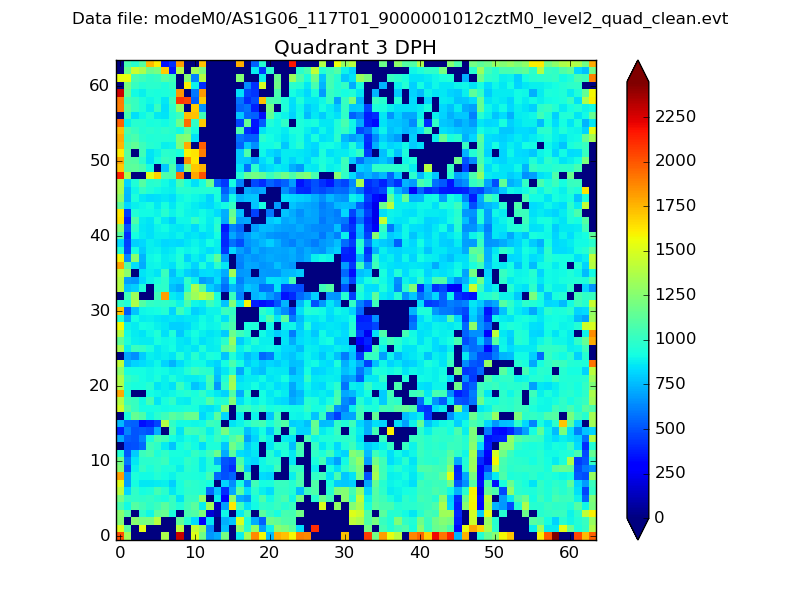 |
 |
Quadrant C |
| Plot type | Count rate plots | Images |
|---|---|---|
| Comparison with Poisson distribution Blue bars denote a histogram of data divided into 1 sec bins. Red curve is a Poisson curve with rate = median count rate of data. |
 |
 |
| Quadrant-wise count rates Data is divided into 100 sec bins |
 |
|
| Module-wise count rates for Quadrant A Data is divided into 100 sec bins |
 |
 |
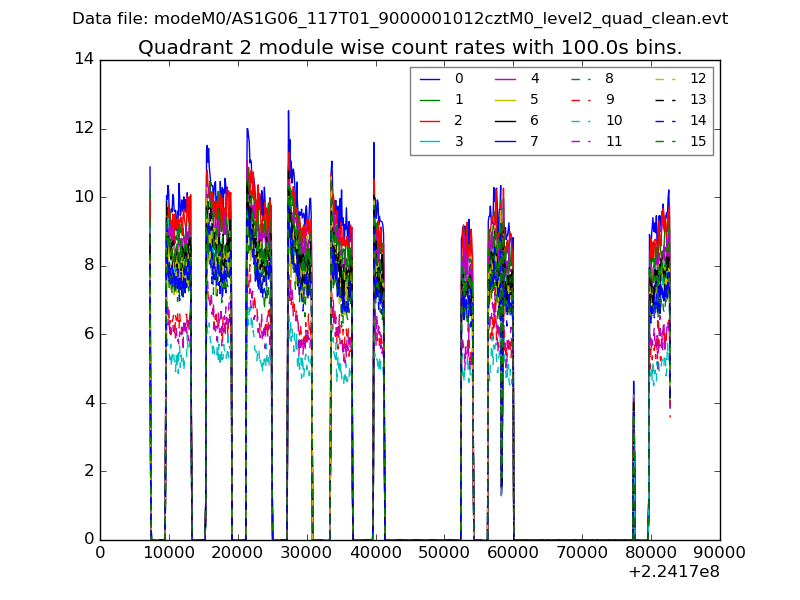
| Module-wise count rates for Quadrant B Data is divided into 100 sec bins |
 |
 |
| Module-wise count rates for Quadrant C Data is divided into 100 sec bins |
 |
 |
| Module-wise count rates for Quadrant D Data is divided into 100 sec bins |
 |
 |
| Parameter | Plot |
|---|---|
| CZT HV Monitor |  |
| D_VDD | 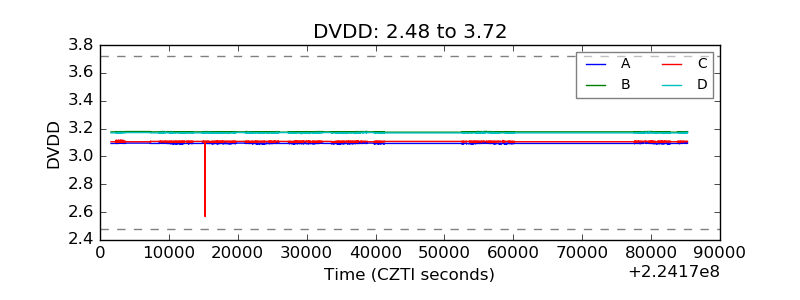 |
| Temperature 1 | 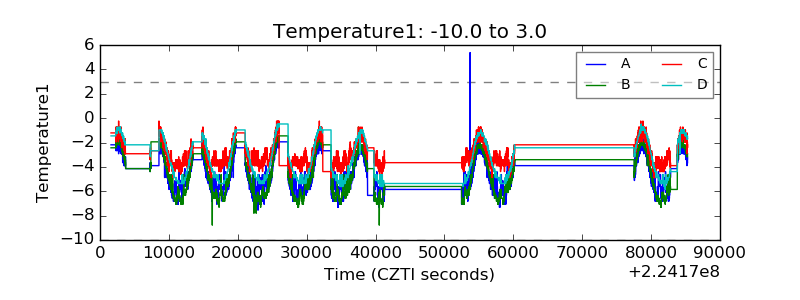 |
| Veto HV Monitor | 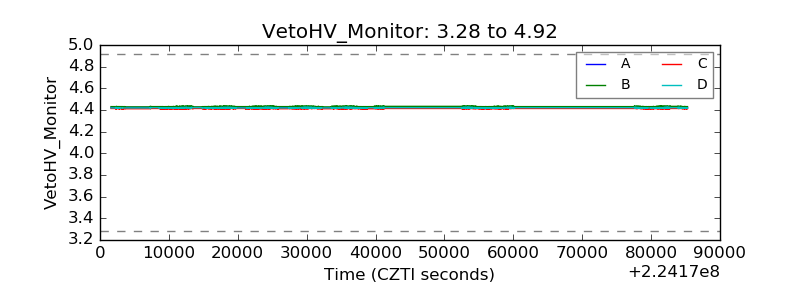 |
| Veto LLD |  |
| Alpha Counter |  |
| _CPM_Rate |  |
| CZT Counter |  |
| +2.5 Volts monitor | 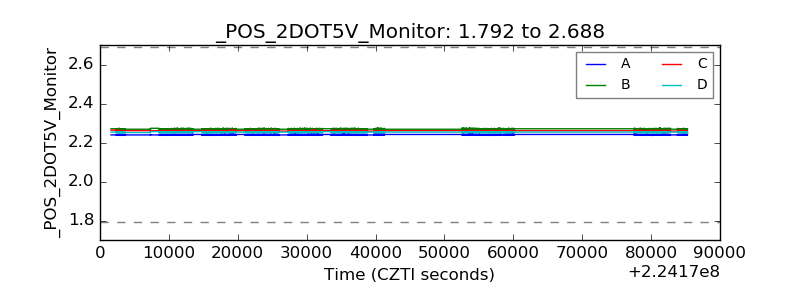 |
| +5 Volts monitor |  |
| _ROLL_ROT |  |
| _Roll_DEC |  |
| _Roll_RA |  |
| Veto Counter |  |