| Param | Original file | Final file |
|---|---|---|
| Filename | modeM0/AS1G06_157T02_9000001008cztM0_level2.evt | modeM0/AS1G06_157T02_9000001008cztM0_level2_quad_clean.evt |
| Size (bytes) | 10,730,413,440 | 1,914,842,880 |
| Size | 10.0 GB | 1.8 GB |
| Events in quadrant A | 73,567,096 | 11,952,530 |
| Events in quadrant B | 73,414,477 | 12,280,308 |
| Events in quadrant C | 76,654,169 | 12,119,830 |
| Events in quadrant D | 91,231,075 | 11,378,987 |
| Mode M9 | |||
|---|---|---|---|
| Quadrant | BADHDUFLAG | Total packets | Discarded packets |
| A | 0 | 239 | 0 |
| B | 0 | 239 | 0 |
| C | 0 | 239 | 0 |
| D | 0 | 239 | 0 |
| Mode M0 | |||
|---|---|---|---|
| Quadrant | BADHDUFLAG | Total packets | Discarded packets |
| A | 0 | 322505 | 0 |
| B | 0 | 319483 | 0 |
| C | 0 | 328307 | 0 |
| D | 0 | 376784 | 0 |
| Mode SS | |||
|---|---|---|---|
| Quadrant | BADHDUFLAG | Total packets | Discarded packets |
| A | 0 | 3052 | 0 |
| B | 0 | 3054 | 0 |
| C | 0 | 3052 | 0 |
| D | 0 | 3052 | 0 |
| Quadrant | Total seconds | Saturated seconds | Saturation percentage |
|---|---|---|---|
| A | 149864 | 3413 | 2.277398% |
| B | 149868 | 2256 | 1.505325% |
| C | 149867 | 1577 | 1.052266% |
| D | 149850 | 6531 | 4.358358% |
Noise dominated data is calculated using 1-second bins in cleaned event files. If a bin has >2000 counts, and if more than 50% of those come from <1% of pixels, then it is considered to be noise-dominated and hence unusable.
| Quadrant | # 1 sec bins | Bins with >0 counts | Bins with >2000 counts | High rate bins dominated by noise | Noise dominated (total time) | Noise dominated (detector-on time) | Marked lightcurve |
|---|---|---|---|---|---|---|---|
| A | 180131 | 149931 | 1118 | 1118 | 0.62% | 0.75% |  |
| B | 180131 | 149931 | 117 | 117 | 0.06% | 0.08% |  |
| C | 180131 | 149925 | 22 | 22 | 0.01% | 0.01% |  |
| D | 180131 | 149919 | 4500 | 4500 | 2.50% | 3.00% |  |
Top three noisy pixels from each quadrant. If the there are fewer than three noisy pixels in the level2.evt file, extra rows are filled as -1
| Pixel properties | Quadrant properties | ||||||
|---|---|---|---|---|---|---|---|
| Quadrant | DetID | PixID | Counts | Sigma | Mean | Median | Sigma |
| A | 15 | 234 | 3661786 | 1026.59 | 17657 | 17276 | 3550.1 |
| A | 15 | 239 | 1265124 | 351.5 | 17657 | 17276 | 3550.1 |
| A | 14 | 111 | 591228 | 161.67 | 17657 | 17276 | 3550.1 |
| B | 0 | 214 | 1801632 | 525.1 | 17958 | 17528 | 3397.6 |
| B | 11 | 51 | 888401 | 256.32 | 17958 | 17528 | 3397.6 |
| B | 4 | 81 | 601326 | 171.82 | 17958 | 17528 | 3397.6 |
| C | 9 | 68 | 8079374 | 1999.06 | 17380 | 17451 | 4032.9 |
| C | 12 | 80 | 414367 | 98.42 | 17380 | 17451 | 4032.9 |
| C | 13 | 61 | 135248 | 29.21 | 17380 | 17451 | 4032.9 |
| D | 1 | 52 | 11461347 | 2738.71 | 17042 | 16529 | 4178.9 |
| D | 2 | 216 | 5808060 | 1385.9 | 17042 | 16529 | 4178.9 |
| D | 14 | 34 | 2255457 | 535.77 | 17042 | 16529 | 4178.9 |
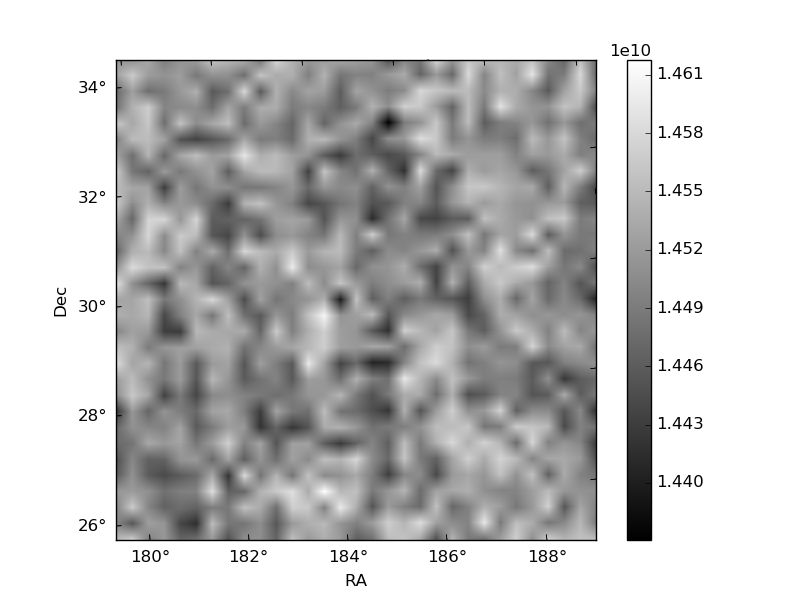
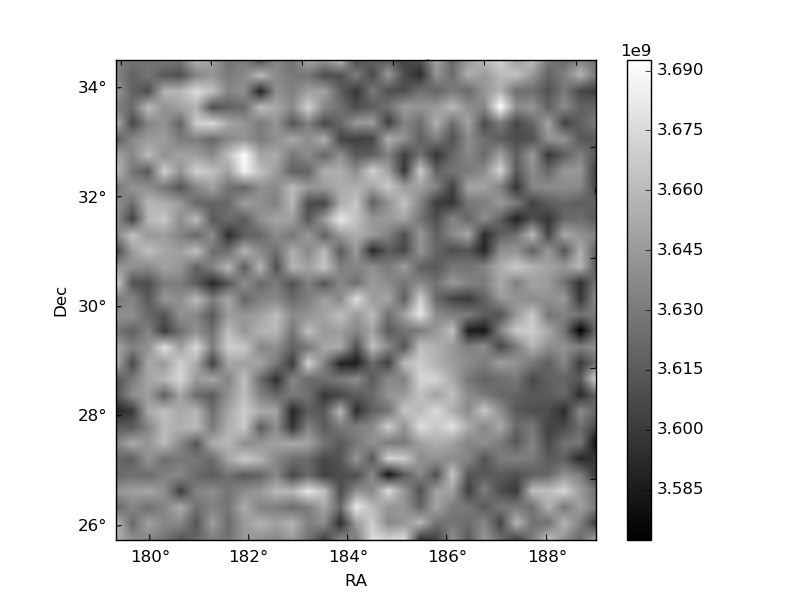
Histogram calculated using DETX and DETY for each event in the final _common_clean file
| Quadrant A |  |
 |
Quadrant B |
|---|---|---|---|
| Quadrant D |  |
 |
Quadrant C |
| Plot type | Count rate plots | Images |
|---|---|---|
| Comparison with Poisson distribution Blue bars denote a histogram of data divided into 1 sec bins. Red curve is a Poisson curve with rate = median count rate of data. |
 |
 |
| Quadrant-wise count rates Data is divided into 100 sec bins |
 |
|
| Module-wise count rates for Quadrant A Data is divided into 100 sec bins |
 |
 |
| Module-wise count rates for Quadrant B Data is divided into 100 sec bins |
 |
 |
| Module-wise count rates for Quadrant C Data is divided into 100 sec bins |
 |
 |
| Module-wise count rates for Quadrant D Data is divided into 100 sec bins |
 |
 |
| Parameter | Plot |
|---|---|
| CZT HV Monitor |  |
| D_VDD |  |
| Temperature 1 |  |
| Veto HV Monitor |  |
| Veto LLD |  |
| Alpha Counter |  |
| _CPM_Rate | 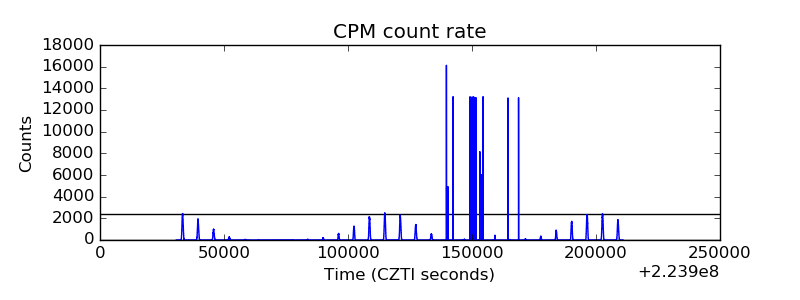 |
| CZT Counter |  |
| +2.5 Volts monitor |  |
| +5 Volts monitor |  |
| _ROLL_ROT |  |
| _Roll_DEC |  |
| _Roll_RA |  |
| Veto Counter | 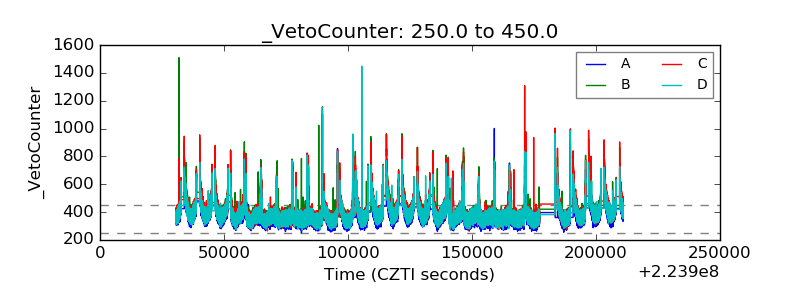 |