| Param | Original file | Final file |
|---|---|---|
| Filename | modeM0/AS1G06_164T01_9000001004cztM0_level2.evt | modeM0/AS1G06_164T01_9000001004cztM0_level2_quad_clean.evt |
| Size (bytes) | 1,901,004,480 | 395,133,120 |
| Size | 1.8 GB | 376.8 MB |
| Events in quadrant A | 14,083,294 | 2,534,688 |
| Events in quadrant B | 13,597,338 | 2,548,919 |
| Events in quadrant C | 12,808,178 | 2,510,738 |
| Events in quadrant D | 15,139,942 | 2,397,477 |
| Mode M9 | |||
|---|---|---|---|
| Quadrant | BADHDUFLAG | Total packets | Discarded packets |
| A | 0 | 16 | 0 |
| B | 0 | 16 | 0 |
| C | 0 | 16 | 0 |
| D | 0 | 16 | 0 |
| Mode M0 | |||
|---|---|---|---|
| Quadrant | BADHDUFLAG | Total packets | Discarded packets |
| A | 0 | 62011 | 0 |
| B | 0 | 60082 | 0 |
| C | 0 | 59074 | 0 |
| D | 0 | 65004 | 0 |
| Mode SS | |||
|---|---|---|---|
| Quadrant | BADHDUFLAG | Total packets | Discarded packets |
| A | 0 | 584 | 0 |
| B | 0 | 584 | 0 |
| C | 0 | 582 | 0 |
| D | 0 | 584 | 0 |
| Quadrant | Total seconds | Saturated seconds | Saturation percentage |
|---|---|---|---|
| A | 28737 | 814 | 2.832585% |
| B | 28741 | 670 | 2.331165% |
| C | 28741 | 381 | 1.325632% |
| D | 28740 | 560 | 1.948504% |
Noise dominated data is calculated using 1-second bins in cleaned event files. If a bin has >2000 counts, and if more than 50% of those come from <1% of pixels, then it is considered to be noise-dominated and hence unusable.
| Quadrant | # 1 sec bins | Bins with >0 counts | Bins with >2000 counts | High rate bins dominated by noise | Noise dominated (total time) | Noise dominated (detector-on time) | Marked lightcurve |
|---|---|---|---|---|---|---|---|
| A | 30341 | 28748 | 113 | 113 | 0.37% | 0.39% |  |
| B | 30341 | 28748 | 23 | 23 | 0.08% | 0.08% | 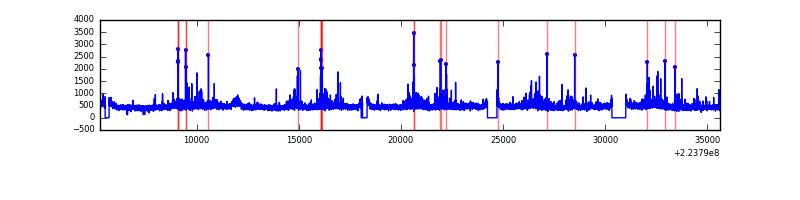 |
| C | 30341 | 28749 | 1 | 1 | 0.00% | 0.00% |  |
| D | 30341 | 28749 | 87 | 87 | 0.29% | 0.30% | 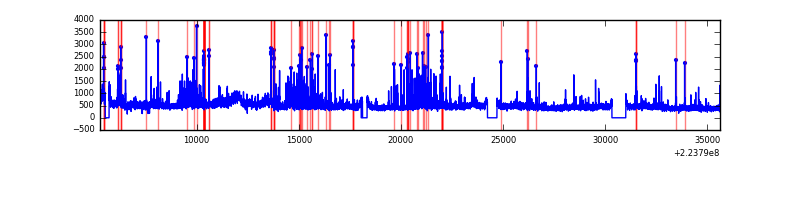 |
Top three noisy pixels from each quadrant. If the there are fewer than three noisy pixels in the level2.evt file, extra rows are filled as -1
| Pixel properties | Quadrant properties | ||||||
|---|---|---|---|---|---|---|---|
| Quadrant | DetID | PixID | Counts | Sigma | Mean | Median | Sigma |
| A | 8 | 15 | 851689 | 1299.61 | 3245 | 3164 | 652.9 |
| A | 15 | 234 | 502044 | 764.09 | 3245 | 3164 | 652.9 |
| A | 13 | 248 | 84854 | 125.12 | 3245 | 3164 | 652.9 |
| B | 11 | 51 | 371251 | 596.85 | 3278 | 3194 | 616.7 |
| B | 0 | 214 | 345140 | 554.5 | 3278 | 3194 | 616.7 |
| B | 4 | 81 | 98020 | 153.77 | 3278 | 3194 | 616.7 |
| C | 9 | 68 | 371711 | 503.58 | 3180 | 3179 | 731.8 |
| C | 13 | 61 | 24395 | 28.99 | 3180 | 3179 | 731.8 |
| C | 8 | 128 | 15216 | 16.45 | 3180 | 3179 | 731.8 |
| D | 1 | 20 | 1704447 | 2228.71 | 3151 | 3047 | 763.4 |
| D | 2 | 216 | 938099 | 1224.85 | 3151 | 3047 | 763.4 |
| D | 1 | 52 | 206552 | 266.58 | 3151 | 3047 | 763.4 |
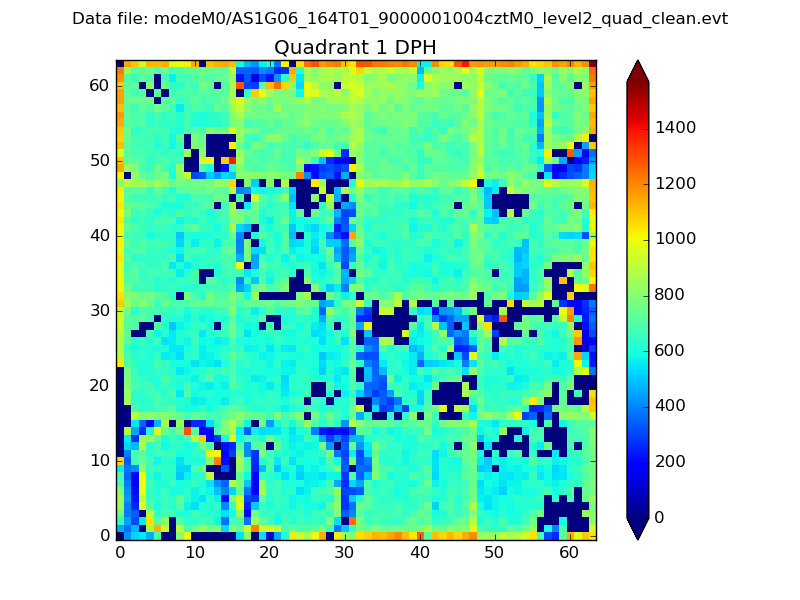
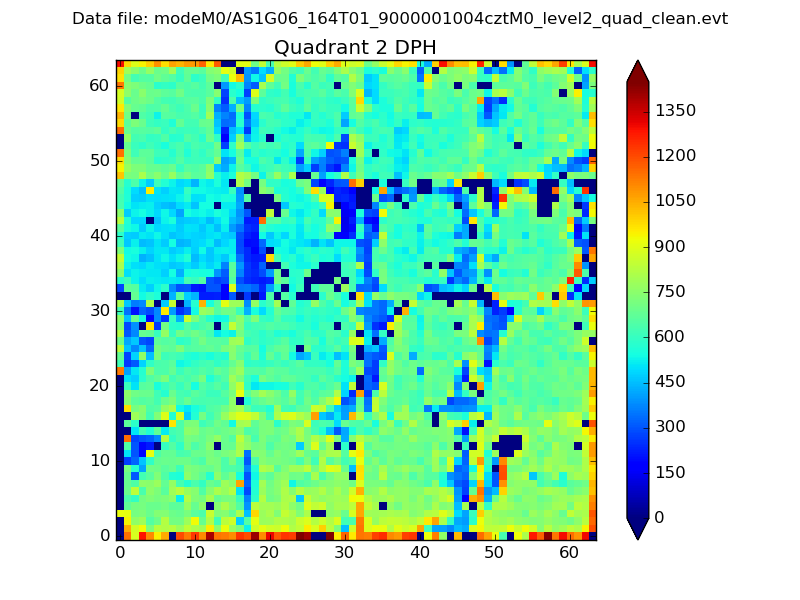
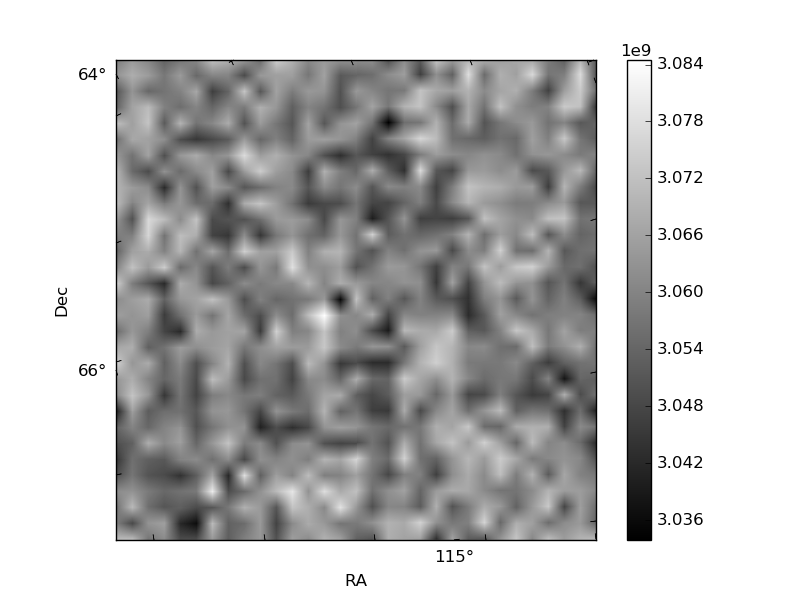
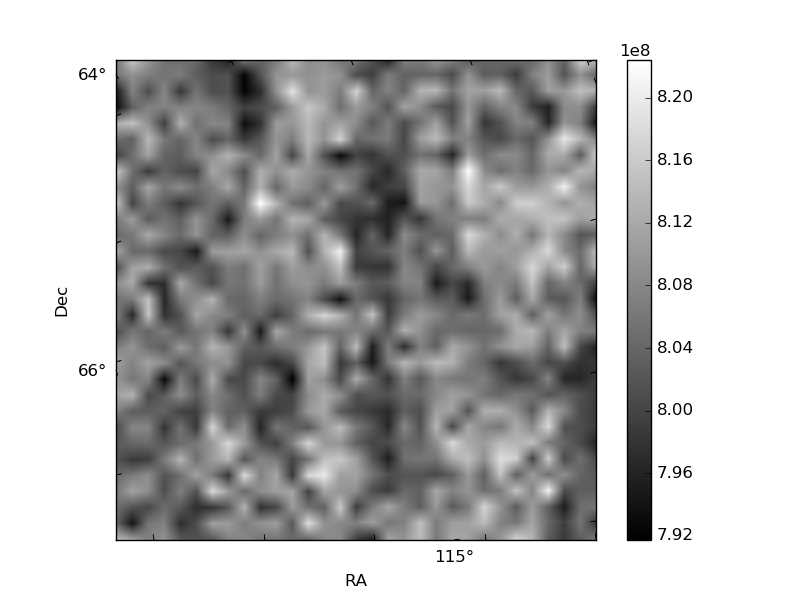
Histogram calculated using DETX and DETY for each event in the final _common_clean file
| Quadrant A |  |
 |
Quadrant B |
|---|---|---|---|
| Quadrant D |  |
 |
Quadrant C |
| Plot type | Count rate plots | Images |
|---|---|---|
| Comparison with Poisson distribution Blue bars denote a histogram of data divided into 1 sec bins. Red curve is a Poisson curve with rate = median count rate of data. |
 |
 |
| Quadrant-wise count rates Data is divided into 100 sec bins |
 |
|
| Module-wise count rates for Quadrant A Data is divided into 100 sec bins |
 |
 |
| Module-wise count rates for Quadrant B Data is divided into 100 sec bins |
 |
 |
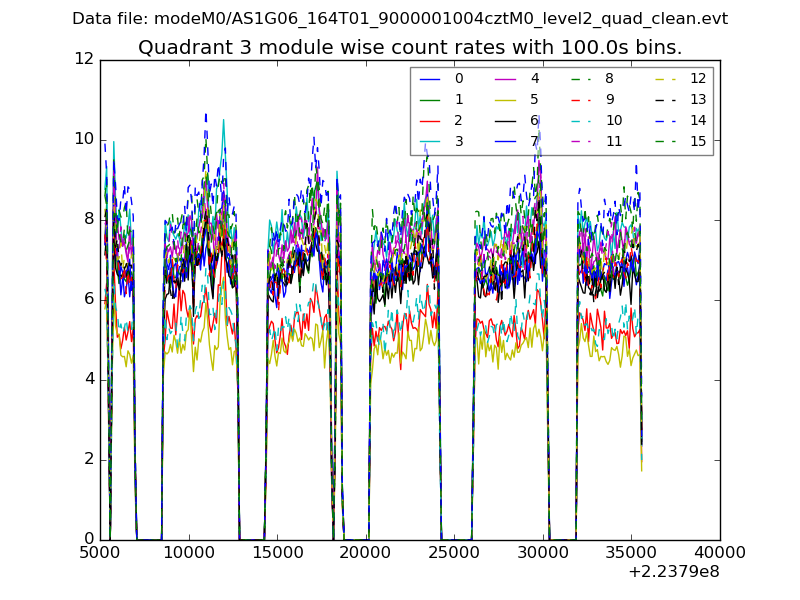
| Module-wise count rates for Quadrant C Data is divided into 100 sec bins |
 |
 |
| Module-wise count rates for Quadrant D Data is divided into 100 sec bins |
 |
 |
| Parameter | Plot |
|---|---|
| CZT HV Monitor |  |
| D_VDD | 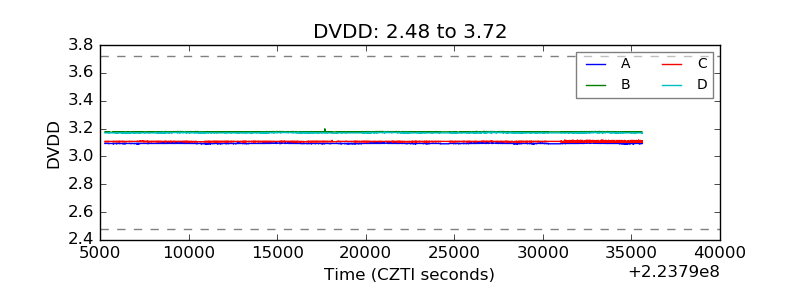 |
| Temperature 1 | 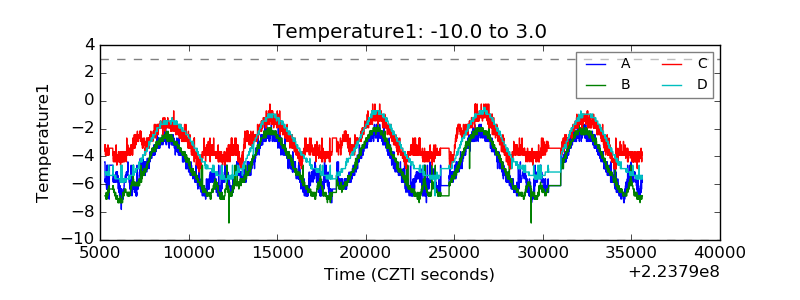 |
| Veto HV Monitor |  |
| Veto LLD | 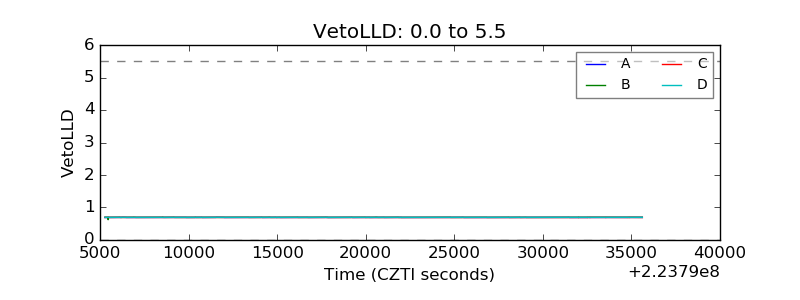 |
| Alpha Counter |  |
| _CPM_Rate |  |
| CZT Counter |  |
| +2.5 Volts monitor |  |
| +5 Volts monitor |  |
| _ROLL_ROT |  |
| _Roll_DEC |  |
| _Roll_RA |  |
| Veto Counter |  |