| Param | Original file | Final file |
|---|---|---|
| Filename | modeM0/AS1A02_178T01_9000001006cztM0_level2.evt | modeM0/AS1A02_178T01_9000001006cztM0_level2_quad_clean.evt |
| Size (bytes) | 7,480,319,040 | 1,109,655,360 |
| Size | 7.0 GB | 1.0 GB |
| Events in quadrant A | 77,456,660 | 6,286,554 |
| Events in quadrant B | 43,650,523 | 7,328,827 |
| Events in quadrant C | 50,853,989 | 7,112,499 |
| Events in quadrant D | 48,603,508 | 6,796,792 |
| Mode SS | |||
|---|---|---|---|
| Quadrant | BADHDUFLAG | Total packets | Discarded packets |
| A | 0 | 1804 | 0 |
| B | 0 | 1804 | 0 |
| C | 0 | 1804 | 0 |
| D | 0 | 1804 | 0 |
| Mode M9 | |||
|---|---|---|---|
| Quadrant | BADHDUFLAG | Total packets | Discarded packets |
| A | 0 | 137 | 0 |
| B | 0 | 137 | 0 |
| C | 0 | 137 | 0 |
| D | 0 | 138 | 0 |
| Mode M0 | |||
|---|---|---|---|
| Quadrant | BADHDUFLAG | Total packets | Discarded packets |
| A | 0 | 290966 | 0 |
| B | 0 | 189453 | 0 |
| C | 0 | 212524 | 0 |
| D | 0 | 207985 | 0 |
| Quadrant | Total seconds | Saturated seconds | Saturation percentage |
|---|---|---|---|
| A | 88698 | 16698 | 18.825678% |
| B | 88698 | 1161 | 1.308936% |
| C | 88698 | 4282 | 4.827617% |
| D | 88698 | 2211 | 2.492728% |
Noise dominated data is calculated using 1-second bins in cleaned event files. If a bin has >2000 counts, and if more than 50% of those come from <1% of pixels, then it is considered to be noise-dominated and hence unusable.
| Quadrant | # 1 sec bins | Bins with >0 counts | Bins with >2000 counts | High rate bins dominated by noise | Noise dominated (total time) | Noise dominated (detector-on time) | Marked lightcurve |
|---|---|---|---|---|---|---|---|
| A | 102602 | 88702 | 12542 | 12542 | 12.22% | 14.14% |  |
| B | 102602 | 88706 | 46 | 46 | 0.04% | 0.05% |  |
| C | 102602 | 88707 | 3066 | 3066 | 2.99% | 3.46% |  |
| D | 102602 | 88706 | 1050 | 1050 | 1.02% | 1.18% |  |
Top three noisy pixels from each quadrant. If the there are fewer than three noisy pixels in the level2.evt file, extra rows are filled as -1
| Pixel properties | Quadrant properties | ||||||
|---|---|---|---|---|---|---|---|
| Quadrant | DetID | PixID | Counts | Sigma | Mean | Median | Sigma |
| A | 15 | 234 | 39846483 | 21392.32 | 9284 | 9095 | 1862.2 |
| A | 8 | 15 | 813783 | 432.11 | 9284 | 9095 | 1862.2 |
| A | 14 | 111 | 583050 | 308.21 | 9284 | 9095 | 1862.2 |
| B | 0 | 214 | 1008341 | 508.52 | 10542 | 10290 | 1962.6 |
| B | 11 | 51 | 792514 | 398.56 | 10542 | 10290 | 1962.6 |
| B | 4 | 81 | 430343 | 214.02 | 10542 | 10290 | 1962.6 |
| C | 9 | 68 | 11272509 | 4854.06 | 10054 | 10098 | 2320.2 |
| C | 1 | 16 | 260272 | 107.82 | 10054 | 10098 | 2320.2 |
| C | 13 | 61 | 78314 | 29.4 | 10054 | 10098 | 2320.2 |
| D | 2 | 216 | 5804848 | 2365.26 | 10099 | 9792 | 2450.1 |
| D | 12 | 221 | 1411150 | 571.97 | 10099 | 9792 | 2450.1 |
| D | 14 | 34 | 1391501 | 563.95 | 10099 | 9792 | 2450.1 |
Histogram calculated using DETX and DETY for each event in the final _common_clean file
| Quadrant A | 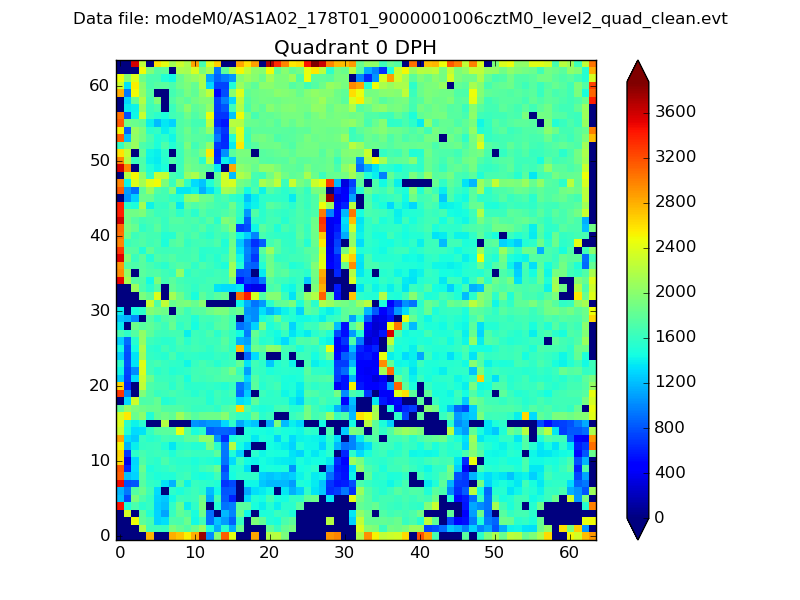 |
 |
Quadrant B |
|---|---|---|---|
| Quadrant D |  |
 |
Quadrant C |
| Plot type | Count rate plots | Images |
|---|---|---|
| Comparison with Poisson distribution Blue bars denote a histogram of data divided into 1 sec bins. Red curve is a Poisson curve with rate = median count rate of data. |
 |
 |
| Quadrant-wise count rates Data is divided into 100 sec bins |
 |
|
| Module-wise count rates for Quadrant A Data is divided into 100 sec bins |
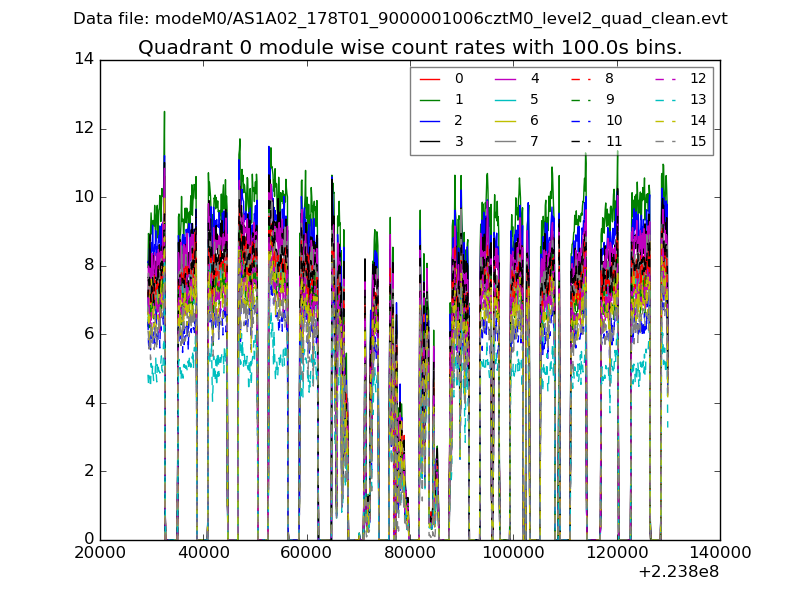 |
 |
| Module-wise count rates for Quadrant B Data is divided into 100 sec bins |
 |
 |
| Module-wise count rates for Quadrant C Data is divided into 100 sec bins |
 |
 |
| Module-wise count rates for Quadrant D Data is divided into 100 sec bins |
 |
 |
| Parameter | Plot |
|---|---|
| CZT HV Monitor |  |
| D_VDD | 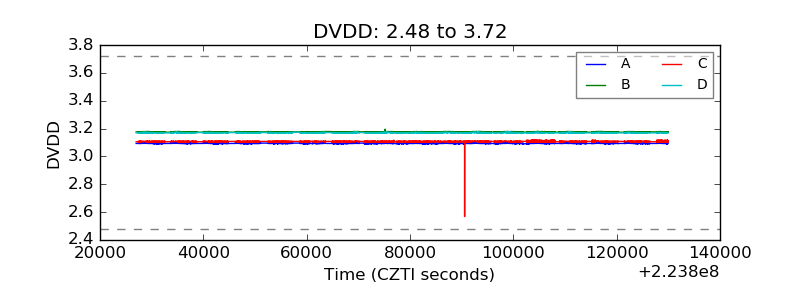 |
| Temperature 1 |  |
| Veto HV Monitor |  |
| Veto LLD |  |
| Alpha Counter |  |
| _CPM_Rate |  |
| CZT Counter |  |
| +2.5 Volts monitor |  |
| +5 Volts monitor |  |
| _ROLL_ROT |  |
| _Roll_DEC |  |
| _Roll_RA |  |
| Veto Counter |  |