| Param | Original file | Final file |
|---|---|---|
| Filename | modeM0/AS1G06_137T02_9000001002cztM0_level2.evt | modeM0/AS1G06_137T02_9000001002cztM0_level2_quad_clean.evt |
| Size (bytes) | 4,603,959,360 | 804,228,480 |
| Size | 4.3 GB | 767.0 MB |
| Events in quadrant A | 33,387,232 | 4,950,547 |
| Events in quadrant B | 31,145,700 | 5,167,170 |
| Events in quadrant C | 29,737,049 | 5,113,221 |
| Events in quadrant D | 40,831,277 | 4,725,110 |
| Mode M9 | |||
|---|---|---|---|
| Quadrant | BADHDUFLAG | Total packets | Discarded packets |
| A | 0 | 108 | 0 |
| B | 0 | 108 | 0 |
| C | 0 | 108 | 0 |
| D | 0 | 108 | 0 |
| Mode SS | |||
|---|---|---|---|
| Quadrant | BADHDUFLAG | Total packets | Discarded packets |
| A | 0 | 1308 | 0 |
| B | 0 | 1308 | 0 |
| C | 0 | 1308 | 0 |
| D | 0 | 1308 | 0 |
| Mode M0 | |||
|---|---|---|---|
| Quadrant | BADHDUFLAG | Total packets | Discarded packets |
| A | 0 | 142958 | 0 |
| B | 0 | 136450 | 0 |
| C | 0 | 133479 | 0 |
| D | 0 | 165667 | 0 |
| Quadrant | Total seconds | Saturated seconds | Saturation percentage |
|---|---|---|---|
| A | 64188 | 1663 | 2.590827% |
| B | 64188 | 892 | 1.389668% |
| C | 64189 | 722 | 1.124803% |
| D | 64191 | 2791 | 4.347962% |
Noise dominated data is calculated using 1-second bins in cleaned event files. If a bin has >2000 counts, and if more than 50% of those come from <1% of pixels, then it is considered to be noise-dominated and hence unusable.
| Quadrant | # 1 sec bins | Bins with >0 counts | Bins with >2000 counts | High rate bins dominated by noise | Noise dominated (total time) | Noise dominated (detector-on time) | Marked lightcurve |
|---|---|---|---|---|---|---|---|
| A | 74927 | 64194 | 738 | 738 | 0.98% | 1.15% |  |
| B | 74927 | 64195 | 29 | 29 | 0.04% | 0.05% |  |
| C | 74927 | 64198 | 96 | 96 | 0.13% | 0.15% |  |
| D | 74927 | 64196 | 1910 | 1910 | 2.55% | 2.98% | 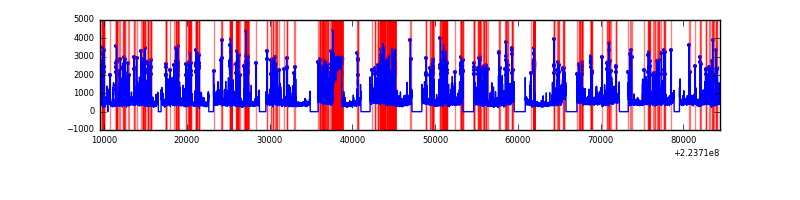 |
Top three noisy pixels from each quadrant. If the there are fewer than three noisy pixels in the level2.evt file, extra rows are filled as -1
| Pixel properties | Quadrant properties | ||||||
|---|---|---|---|---|---|---|---|
| Quadrant | DetID | PixID | Counts | Sigma | Mean | Median | Sigma |
| A | 15 | 234 | 2374654 | 1565.2 | 7502 | 7350 | 1512.5 |
| A | 8 | 15 | 1572183 | 1034.63 | 7502 | 7350 | 1512.5 |
| A | 14 | 111 | 212627 | 135.72 | 7502 | 7350 | 1512.5 |
| B | 0 | 214 | 713612 | 485.57 | 7668 | 7486 | 1454.2 |
| B | 4 | 81 | 400815 | 270.47 | 7668 | 7486 | 1454.2 |
| B | 11 | 51 | 161158 | 105.67 | 7668 | 7486 | 1454.2 |
| C | 1 | 16 | 271745 | 154.96 | 7415 | 7453 | 1705.6 |
| C | 9 | 68 | 264468 | 150.69 | 7415 | 7453 | 1705.6 |
| C | 7 | 247 | 195860 | 110.46 | 7415 | 7453 | 1705.6 |
| D | 2 | 216 | 3989537 | 2235.49 | 7265 | 7043 | 1781.5 |
| D | 1 | 239 | 3006389 | 1683.62 | 7265 | 7043 | 1781.5 |
| D | 1 | 20 | 2597519 | 1454.11 | 7265 | 7043 | 1781.5 |
Histogram calculated using DETX and DETY for each event in the final _common_clean file
| Quadrant A |  |
 |
Quadrant B |
|---|---|---|---|
| Quadrant D |  |
 |
Quadrant C |
| Plot type | Count rate plots | Images |
|---|---|---|
| Comparison with Poisson distribution Blue bars denote a histogram of data divided into 1 sec bins. Red curve is a Poisson curve with rate = median count rate of data. |
 |
 |
| Quadrant-wise count rates Data is divided into 100 sec bins |
 |
|
| Module-wise count rates for Quadrant A Data is divided into 100 sec bins |
 |
 |
| Module-wise count rates for Quadrant B Data is divided into 100 sec bins |
 |
 |
| Module-wise count rates for Quadrant C Data is divided into 100 sec bins |
 |
 |
| Module-wise count rates for Quadrant D Data is divided into 100 sec bins |
 |
 |
| Parameter | Plot |
|---|---|
| CZT HV Monitor |  |
| D_VDD | 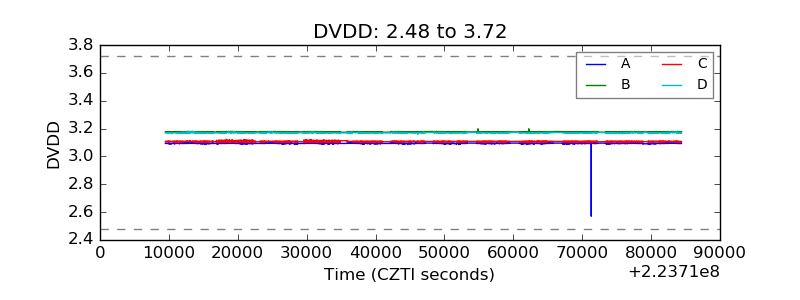 |
| Temperature 1 |  |
| Veto HV Monitor | 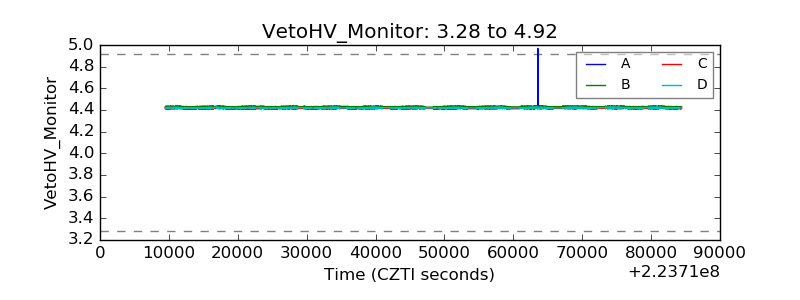 |
| Veto LLD |  |
| Alpha Counter |  |
| _CPM_Rate |  |
| CZT Counter |  |
| +2.5 Volts monitor |  |
| +5 Volts monitor |  |
| _ROLL_ROT |  |
| _Roll_DEC |  |
| _Roll_RA |  |
| Veto Counter |  |