| Param | Original file | Final file |
|---|---|---|
| Filename | modeM0/AS1G06_154T04_9000000998cztM0_level2.evt | modeM0/AS1G06_154T04_9000000998cztM0_level2_quad_clean.evt |
| Size (bytes) | 2,892,672,000 | 519,007,680 |
| Size | 2.7 GB | 495.0 MB |
| Events in quadrant A | 19,769,617 | 3,257,182 |
| Events in quadrant B | 19,579,351 | 3,327,381 |
| Events in quadrant C | 18,841,843 | 3,283,831 |
| Events in quadrant D | 26,671,872 | 3,062,821 |
| Mode M9 | |||
|---|---|---|---|
| Quadrant | BADHDUFLAG | Total packets | Discarded packets |
| A | 0 | 58 | 0 |
| B | 0 | 58 | 0 |
| C | 0 | 58 | 0 |
| D | 0 | 58 | 0 |
| Mode SS | |||
|---|---|---|---|
| Quadrant | BADHDUFLAG | Total packets | Discarded packets |
| A | 0 | 828 | 0 |
| B | 0 | 828 | 0 |
| C | 0 | 828 | 0 |
| D | 0 | 828 | 0 |
| Mode M0 | |||
|---|---|---|---|
| Quadrant | BADHDUFLAG | Total packets | Discarded packets |
| A | 0 | 87266 | 0 |
| B | 0 | 85751 | 0 |
| C | 0 | 84212 | 0 |
| D | 0 | 108039 | 0 |
| Quadrant | Total seconds | Saturated seconds | Saturation percentage |
|---|---|---|---|
| A | 40605 | 1164 | 2.866642% |
| B | 40605 | 556 | 1.369289% |
| C | 40605 | 434 | 1.068834% |
| D | 40605 | 2952 | 7.270041% |
Noise dominated data is calculated using 1-second bins in cleaned event files. If a bin has >2000 counts, and if more than 50% of those come from <1% of pixels, then it is considered to be noise-dominated and hence unusable.
| Quadrant | # 1 sec bins | Bins with >0 counts | Bins with >2000 counts | High rate bins dominated by noise | Noise dominated (total time) | Noise dominated (detector-on time) | Marked lightcurve |
|---|---|---|---|---|---|---|---|
| A | 46455 | 40606 | 162 | 162 | 0.35% | 0.40% | 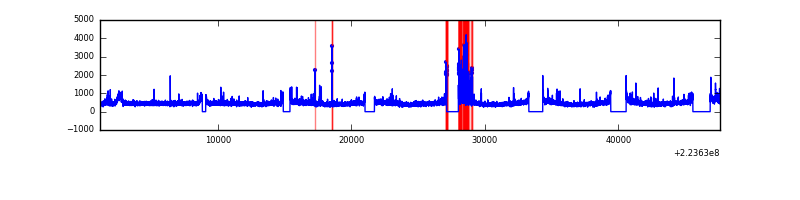 |
| B | 46455 | 40607 | 26 | 26 | 0.06% | 0.06% | 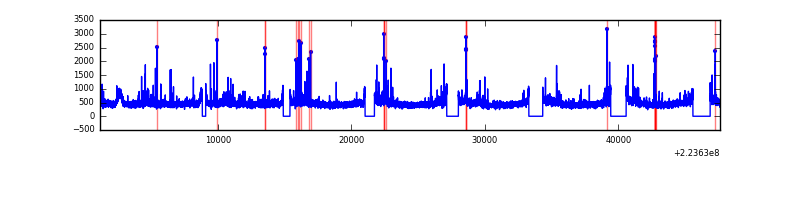 |
| C | 46455 | 40607 | 9 | 9 | 0.02% | 0.02% |  |
| D | 46455 | 40608 | 2493 | 2493 | 5.37% | 6.14% |  |
Top three noisy pixels from each quadrant. If the there are fewer than three noisy pixels in the level2.evt file, extra rows are filled as -1
| Pixel properties | Quadrant properties | ||||||
|---|---|---|---|---|---|---|---|
| Quadrant | DetID | PixID | Counts | Sigma | Mean | Median | Sigma |
| A | 15 | 239 | 1026560 | 1058.64 | 4756 | 4654 | 965.3 |
| A | 15 | 234 | 142973 | 143.29 | 4756 | 4654 | 965.3 |
| A | 8 | 15 | 124686 | 124.35 | 4756 | 4654 | 965.3 |
| B | 0 | 214 | 413058 | 440.6 | 4858 | 4735 | 926.7 |
| B | 4 | 81 | 190063 | 199.98 | 4858 | 4735 | 926.7 |
| B | 12 | 111 | 96014 | 98.5 | 4858 | 4735 | 926.7 |
| C | 9 | 68 | 386040 | 350.43 | 4703 | 4719 | 1088.2 |
| C | 1 | 16 | 89577 | 77.98 | 4703 | 4719 | 1088.2 |
| C | 13 | 61 | 36204 | 28.93 | 4703 | 4719 | 1088.2 |
| D | 12 | 221 | 5834135 | 5203.92 | 4580 | 4444 | 1120.2 |
| D | 2 | 216 | 1261457 | 1122.08 | 4580 | 4444 | 1120.2 |
| D | 2 | 14 | 869101 | 771.84 | 4580 | 4444 | 1120.2 |
Histogram calculated using DETX and DETY for each event in the final _common_clean file
| Quadrant A |  |
 |
Quadrant B |
|---|---|---|---|
| Quadrant D | 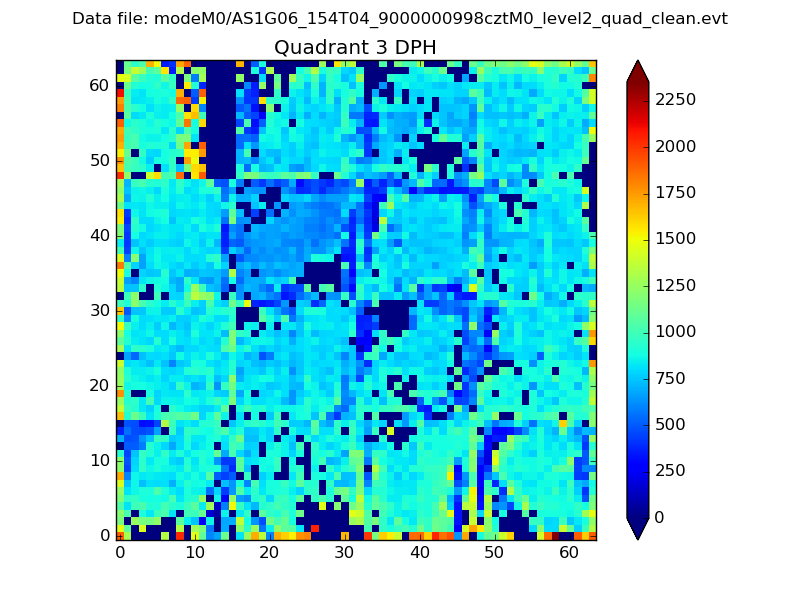 |
 |
Quadrant C |
| Plot type | Count rate plots | Images |
|---|---|---|
| Comparison with Poisson distribution Blue bars denote a histogram of data divided into 1 sec bins. Red curve is a Poisson curve with rate = median count rate of data. |
 |
 |
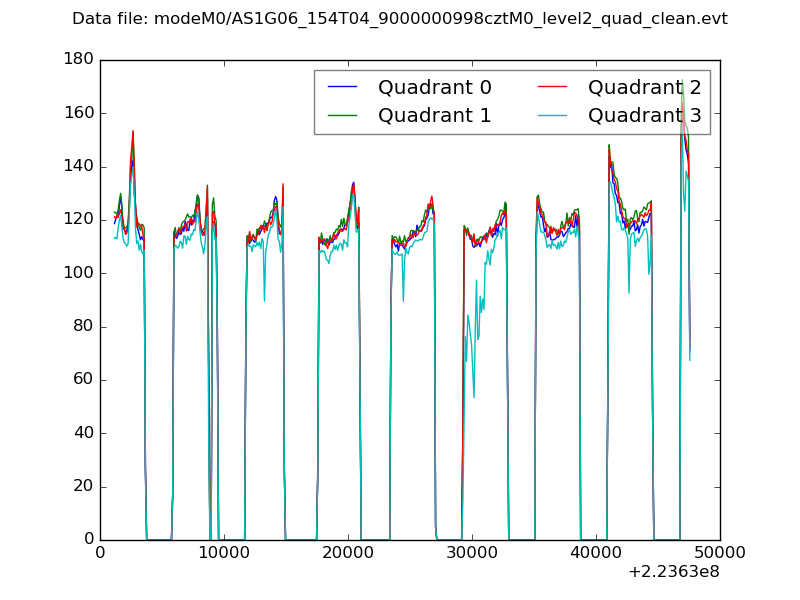
| Quadrant-wise count rates Data is divided into 100 sec bins |
 |
|
| Module-wise count rates for Quadrant A Data is divided into 100 sec bins |
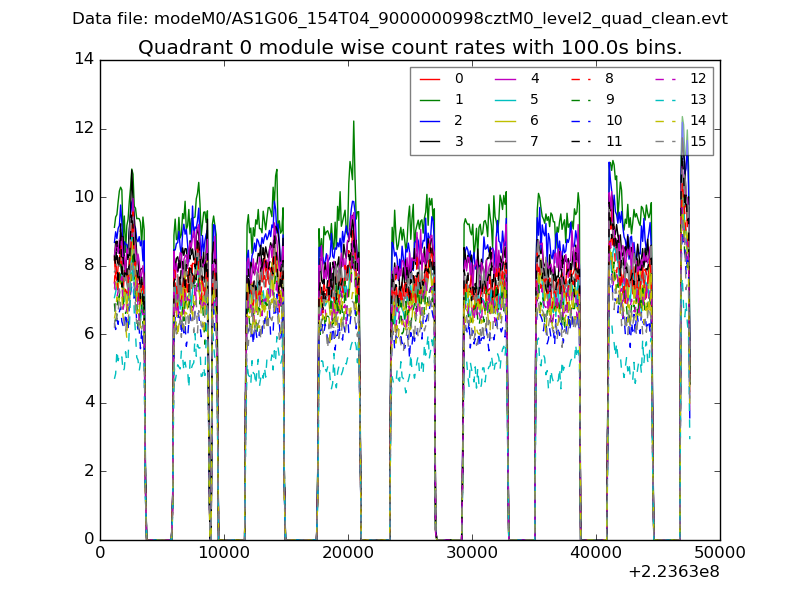 |
 |
| Module-wise count rates for Quadrant B Data is divided into 100 sec bins |
 |
 |
| Module-wise count rates for Quadrant C Data is divided into 100 sec bins |
 |
 |
| Module-wise count rates for Quadrant D Data is divided into 100 sec bins |
 |
 |
| Parameter | Plot |
|---|---|
| CZT HV Monitor |  |
| D_VDD |  |
| Temperature 1 |  |
| Veto HV Monitor |  |
| Veto LLD | 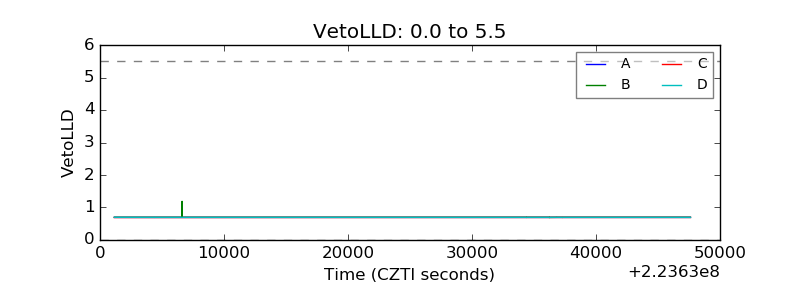 |
| Alpha Counter | 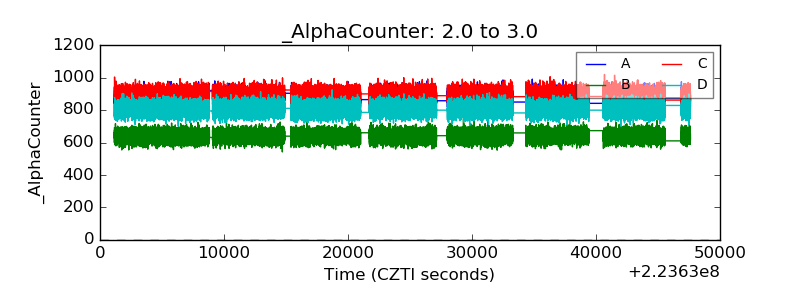 |
| _CPM_Rate |  |
| CZT Counter |  |
| +2.5 Volts monitor | 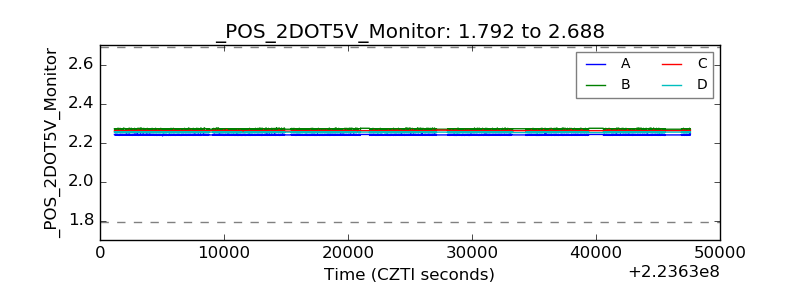 |
| +5 Volts monitor |  |
| _ROLL_ROT | 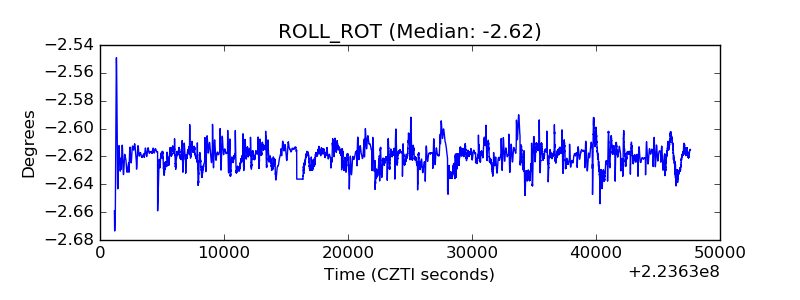 |
| _Roll_DEC |  |
| _Roll_RA |  |
| Veto Counter |  |