| Param | Original file | Final file |
|---|---|---|
| Filename | modeM0/AS1G06_137T01_9000001000cztM0_level2.evt | modeM0/AS1G06_137T01_9000001000cztM0_level2_quad_clean.evt |
| Size (bytes) | 2,131,536,960 | 410,509,440 |
| Size | 2.0 GB | 391.5 MB |
| Events in quadrant A | 16,532,825 | 2,513,203 |
| Events in quadrant B | 15,132,103 | 2,657,329 |
| Events in quadrant C | 15,215,919 | 2,606,205 |
| Events in quadrant D | 15,531,954 | 2,479,658 |
| Mode SS | |||
|---|---|---|---|
| Quadrant | BADHDUFLAG | Total packets | Discarded packets |
| A | 0 | 644 | 0 |
| B | 0 | 644 | 0 |
| C | 0 | 644 | 0 |
| D | 0 | 642 | 0 |
| Mode M0 | |||
|---|---|---|---|
| Quadrant | BADHDUFLAG | Total packets | Discarded packets |
| A | 0 | 70623 | 0 |
| B | 0 | 66679 | 0 |
| C | 0 | 67284 | 0 |
| D | 0 | 69656 | 0 |
| Mode M9 | |||
|---|---|---|---|
| Quadrant | BADHDUFLAG | Total packets | Discarded packets |
| A | 0 | 53 | 0 |
| B | 0 | 53 | 0 |
| C | 0 | 53 | 0 |
| D | 0 | 53 | 0 |
| Quadrant | Total seconds | Saturated seconds | Saturation percentage |
|---|---|---|---|
| A | 31695 | 767 | 2.419940% |
| B | 31688 | 354 | 1.117142% |
| C | 31698 | 261 | 0.823396% |
| D | 31693 | 408 | 1.287351% |
Noise dominated data is calculated using 1-second bins in cleaned event files. If a bin has >2000 counts, and if more than 50% of those come from <1% of pixels, then it is considered to be noise-dominated and hence unusable.
| Quadrant | # 1 sec bins | Bins with >0 counts | Bins with >2000 counts | High rate bins dominated by noise | Noise dominated (total time) | Noise dominated (detector-on time) | Marked lightcurve |
|---|---|---|---|---|---|---|---|
| A | 41084 | 31723 | 427 | 427 | 1.04% | 1.35% |  |
| B | 41084 | 31723 | 14 | 14 | 0.03% | 0.04% | 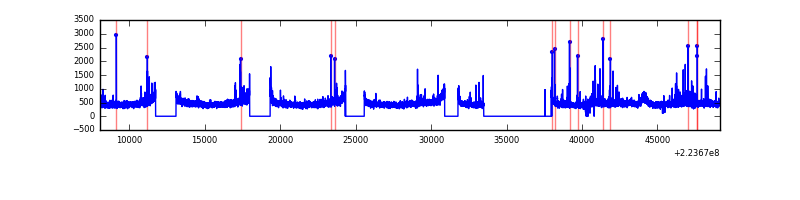 |
| C | 41084 | 31730 | 92 | 92 | 0.22% | 0.29% |  |
| D | 41084 | 31730 | 176 | 176 | 0.43% | 0.55% |  |
Top three noisy pixels from each quadrant. If the there are fewer than three noisy pixels in the level2.evt file, extra rows are filled as -1
| Pixel properties | Quadrant properties | ||||||
|---|---|---|---|---|---|---|---|
| Quadrant | DetID | PixID | Counts | Sigma | Mean | Median | Sigma |
| A | 15 | 234 | 1233276 | 1651.19 | 3692 | 3614 | 744.7 |
| A | 8 | 15 | 965333 | 1291.39 | 3692 | 3614 | 744.7 |
| A | 15 | 239 | 81005 | 103.92 | 3692 | 3614 | 744.7 |
| B | 0 | 214 | 286322 | 397.01 | 3792 | 3710 | 711.8 |
| B | 4 | 81 | 121044 | 164.83 | 3792 | 3710 | 711.8 |
| B | 12 | 111 | 74003 | 98.75 | 3792 | 3710 | 711.8 |
| C | 9 | 68 | 689379 | 814.48 | 3652 | 3669 | 841.9 |
| C | 1 | 16 | 186569 | 217.25 | 3652 | 3669 | 841.9 |
| C | 7 | 247 | 82338 | 93.44 | 3652 | 3669 | 841.9 |
| D | 2 | 14 | 729824 | 813.48 | 3645 | 3536 | 892.8 |
| D | 2 | 216 | 417940 | 464.16 | 3645 | 3536 | 892.8 |
| D | 14 | 34 | 182314 | 200.24 | 3645 | 3536 | 892.8 |
Histogram calculated using DETX and DETY for each event in the final _common_clean file
| Quadrant A |  |
 |
Quadrant B |
|---|---|---|---|
| Quadrant D |  |
 |
Quadrant C |
| Plot type | Count rate plots | Images |
|---|---|---|
| Comparison with Poisson distribution Blue bars denote a histogram of data divided into 1 sec bins. Red curve is a Poisson curve with rate = median count rate of data. |
 |
 |
| Quadrant-wise count rates Data is divided into 100 sec bins |
 |
|
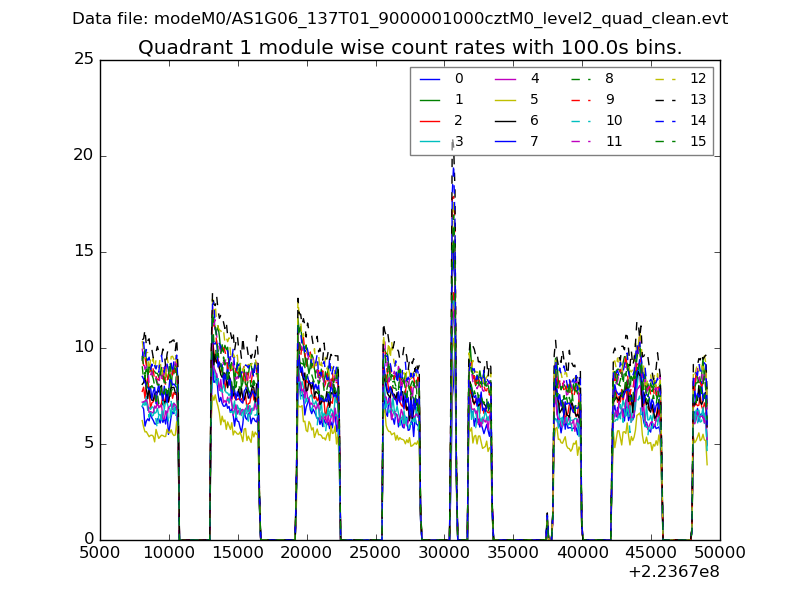
| Module-wise count rates for Quadrant A Data is divided into 100 sec bins |
 |
 |
| Module-wise count rates for Quadrant B Data is divided into 100 sec bins |
 |
 |
| Module-wise count rates for Quadrant C Data is divided into 100 sec bins |
 |
 |
| Module-wise count rates for Quadrant D Data is divided into 100 sec bins |
 |
 |
| Parameter | Plot |
|---|---|
| CZT HV Monitor |  |
| D_VDD |  |
| Temperature 1 |  |
| Veto HV Monitor | 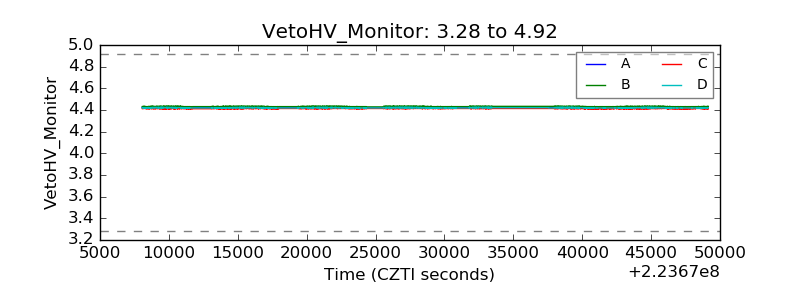 |
| Veto LLD |  |
| Alpha Counter |  |
| _CPM_Rate |  |
| CZT Counter |  |
| +2.5 Volts monitor |  |
| +5 Volts monitor |  |
| _ROLL_ROT |  |
| _Roll_DEC |  |
| _Roll_RA |  |
| Veto Counter |  |