| Param | Original file | Final file |
|---|---|---|
| Filename | modeM0/AS1G06_154T03_9000000996cztM0_level2.evt | modeM0/AS1G06_154T03_9000000996cztM0_level2_quad_clean.evt |
| Size (bytes) | 3,882,792,960 | 729,852,480 |
| Size | 3.6 GB | 696.0 MB |
| Events in quadrant A | 27,723,547 | 4,545,647 |
| Events in quadrant B | 28,363,222 | 4,654,248 |
| Events in quadrant C | 26,880,935 | 4,581,978 |
| Events in quadrant D | 30,710,384 | 4,349,444 |
| Mode SS | |||
|---|---|---|---|
| Quadrant | BADHDUFLAG | Total packets | Discarded packets |
| A | 0 | 1180 | 0 |
| B | 0 | 1180 | 0 |
| C | 0 | 1180 | 0 |
| D | 0 | 1180 | 0 |
| Mode M0 | |||
|---|---|---|---|
| Quadrant | BADHDUFLAG | Total packets | Discarded packets |
| A | 0 | 121749 | 0 |
| B | 0 | 123161 | 0 |
| C | 0 | 119949 | 0 |
| D | 0 | 132850 | 0 |
| Mode M9 | |||
|---|---|---|---|
| Quadrant | BADHDUFLAG | Total packets | Discarded packets |
| A | 0 | 104 | 0 |
| B | 0 | 104 | 0 |
| C | 0 | 104 | 0 |
| D | 0 | 104 | 0 |
| Quadrant | Total seconds | Saturated seconds | Saturation percentage |
|---|---|---|---|
| A | 57950 | 696 | 1.201035% |
| B | 57950 | 814 | 1.404659% |
| C | 57950 | 427 | 0.736842% |
| D | 57950 | 1282 | 2.212252% |
Noise dominated data is calculated using 1-second bins in cleaned event files. If a bin has >2000 counts, and if more than 50% of those come from <1% of pixels, then it is considered to be noise-dominated and hence unusable.
| Quadrant | # 1 sec bins | Bins with >0 counts | Bins with >2000 counts | High rate bins dominated by noise | Noise dominated (total time) | Noise dominated (detector-on time) | Marked lightcurve |
|---|---|---|---|---|---|---|---|
| A | 68402 | 57955 | 39 | 39 | 0.06% | 0.07% |  |
| B | 68402 | 57957 | 100 | 100 | 0.15% | 0.17% | 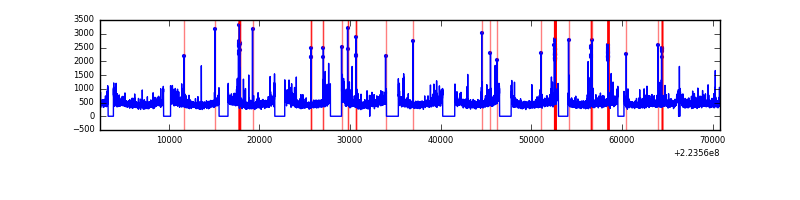 |
| C | 68402 | 57961 | 14 | 14 | 0.02% | 0.02% |  |
| D | 68402 | 57958 | 712 | 712 | 1.04% | 1.23% |  |
Top three noisy pixels from each quadrant. If the there are fewer than three noisy pixels in the level2.evt file, extra rows are filled as -1
| Pixel properties | Quadrant properties | ||||||
|---|---|---|---|---|---|---|---|
| Quadrant | DetID | PixID | Counts | Sigma | Mean | Median | Sigma |
| A | 8 | 15 | 709257 | 503.13 | 6907 | 6766 | 1396.3 |
| A | 15 | 239 | 304890 | 213.52 | 6907 | 6766 | 1396.3 |
| A | 14 | 111 | 90734 | 60.14 | 6907 | 6766 | 1396.3 |
| B | 0 | 214 | 438443 | 327.16 | 6973 | 6805 | 1319.3 |
| B | 4 | 81 | 260041 | 191.94 | 6973 | 6805 | 1319.3 |
| B | 4 | 239 | 173104 | 126.05 | 6973 | 6805 | 1319.3 |
| C | 7 | 247 | 255309 | 160.24 | 6740 | 6776 | 1551.0 |
| C | 14 | 67 | 139825 | 85.78 | 6740 | 6776 | 1551.0 |
| C | 1 | 16 | 126669 | 77.3 | 6740 | 6776 | 1551.0 |
| D | 2 | 216 | 1910143 | 1169.97 | 6680 | 6482 | 1627.1 |
| D | 2 | 14 | 1130592 | 690.87 | 6680 | 6482 | 1627.1 |
| D | 2 | 33 | 757482 | 461.56 | 6680 | 6482 | 1627.1 |
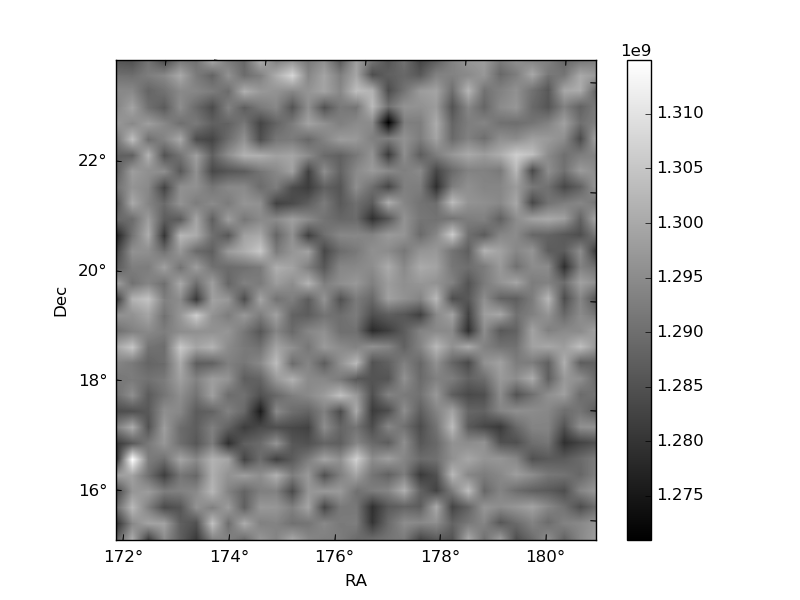
Histogram calculated using DETX and DETY for each event in the final _common_clean file
| Quadrant A |  |
 |
Quadrant B |
|---|---|---|---|
| Quadrant D |  |
 |
Quadrant C |
| Plot type | Count rate plots | Images |
|---|---|---|
| Comparison with Poisson distribution Blue bars denote a histogram of data divided into 1 sec bins. Red curve is a Poisson curve with rate = median count rate of data. |
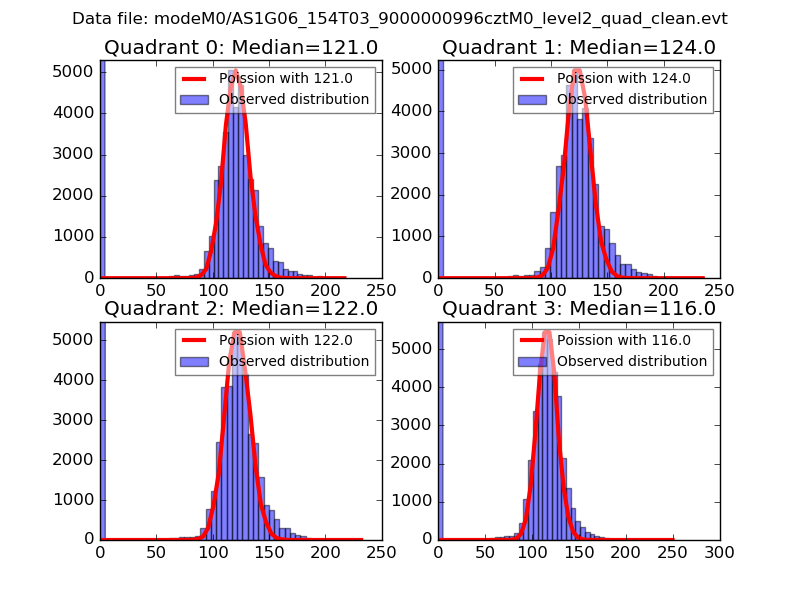 |
 |
| Quadrant-wise count rates Data is divided into 100 sec bins |
 |
|
| Module-wise count rates for Quadrant A Data is divided into 100 sec bins |
 |
 |
| Module-wise count rates for Quadrant B Data is divided into 100 sec bins |
 |
 |
| Module-wise count rates for Quadrant C Data is divided into 100 sec bins |
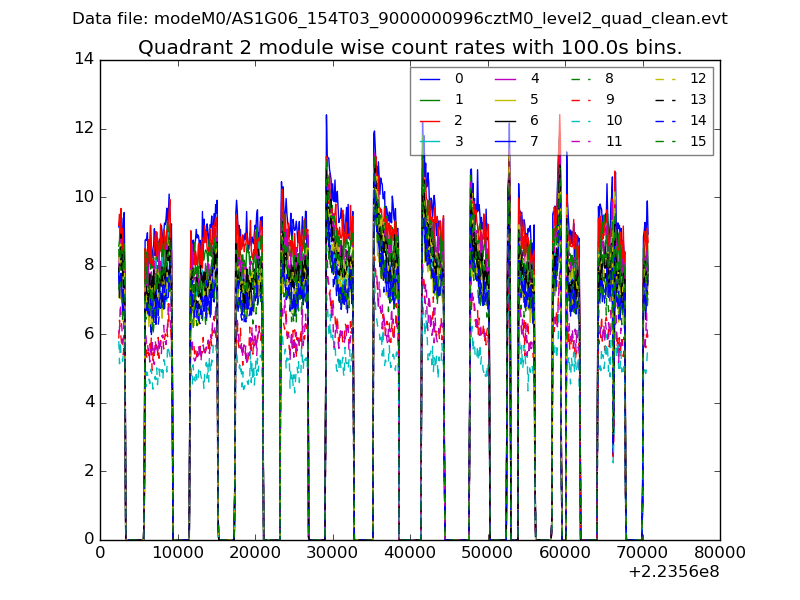 |
 |
| Module-wise count rates for Quadrant D Data is divided into 100 sec bins |
 |
 |
| Parameter | Plot |
|---|---|
| CZT HV Monitor |  |
| D_VDD |  |
| Temperature 1 | 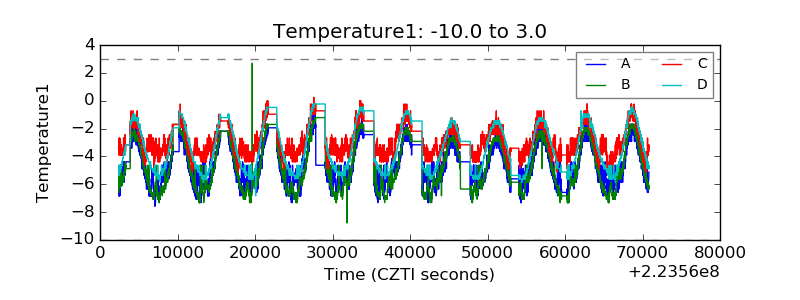 |
| Veto HV Monitor | 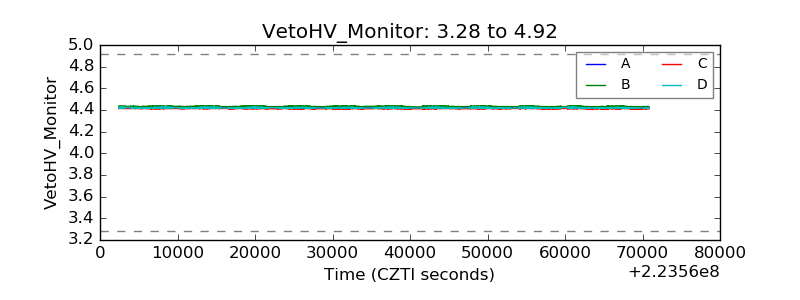 |
| Veto LLD | 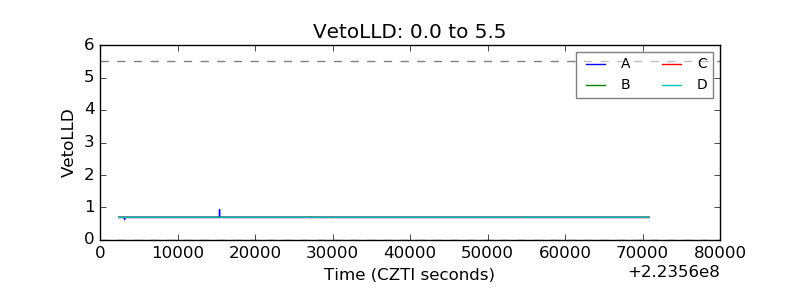 |
| Alpha Counter |  |
| _CPM_Rate |  |
| CZT Counter | 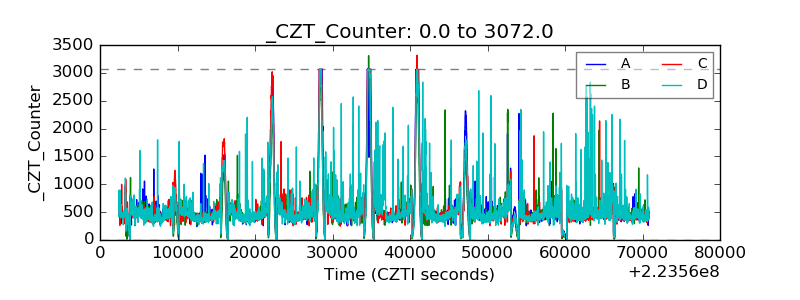 |
| +2.5 Volts monitor | 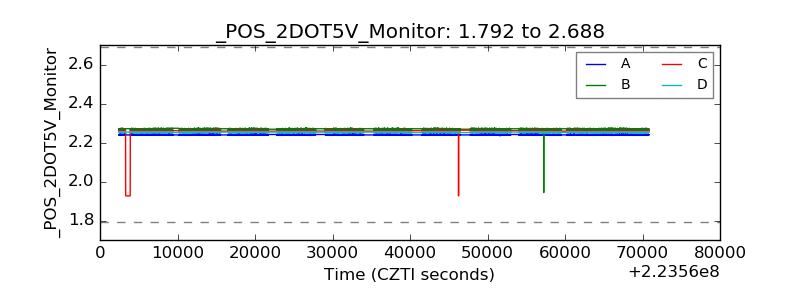 |
| +5 Volts monitor |  |
| _ROLL_ROT |  |
| _Roll_DEC | 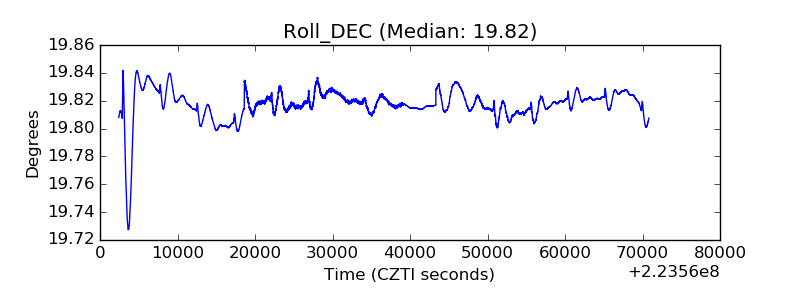 |
| _Roll_RA | 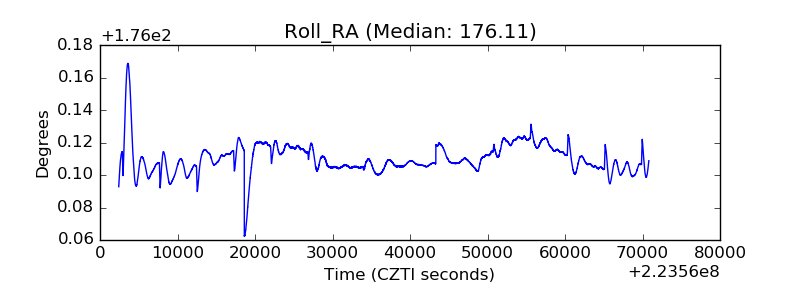 |
| Veto Counter | 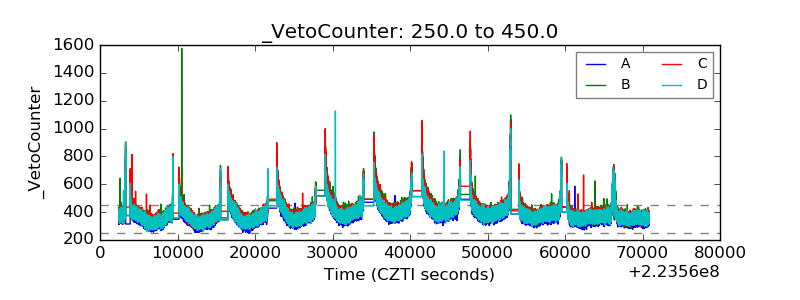 |