| Param | Original file | Final file |
|---|---|---|
| Filename | modeM0/AS1C02_016T01_9000000992cztM0_level2_bc.evt | modeM0/AS1C02_016T01_9000000992cztM0_level2_quad_clean.evt |
| Size (bytes) | 239,569,920 | 135,236,160 |
| Size | 228.5 MB | 129.0 MB |
| Events in quadrant A | 1,545,760 | 898,962 |
| Events in quadrant B | 1,724,353 | 911,270 |
| Events in quadrant C | 1,396,038 | 889,855 |
| Events in quadrant D | 2,053,634 | 857,675 |
| Mode SS | |||
|---|---|---|---|
| Quadrant | BADHDUFLAG | Total packets | Discarded packets |
| A | 0 | 156 | 0 |
| B | 0 | 156 | 0 |
| C | 0 | 156 | 0 |
| D | 0 | 156 | 0 |
| Mode M9 | |||
|---|---|---|---|
| Quadrant | BADHDUFLAG | Total packets | Discarded packets |
| A | 0 | 5 | 0 |
| B | 0 | 5 | 0 |
| C | 0 | 5 | 0 |
| D | 0 | 5 | 0 |
| Mode M0 | |||
|---|---|---|---|
| Quadrant | BADHDUFLAG | Total packets | Discarded packets |
| A | 0 | 15825 | 0 |
| B | 0 | 16494 | 0 |
| C | 0 | 15624 | 0 |
| D | 0 | 17852 | 0 |
| Quadrant | Total seconds | Saturated seconds | Saturation percentage |
|---|---|---|---|
| A | 7746 | 74 | 0.955332% |
| B | 7746 | 86 | 1.110250% |
| C | 7746 | 44 | 0.568035% |
| D | 7746 | 92 | 1.187710% |
Noise dominated data is calculated using 1-second bins in cleaned event files. If a bin has >2000 counts, and if more than 50% of those come from <1% of pixels, then it is considered to be noise-dominated and hence unusable.
| Quadrant | # 1 sec bins | Bins with >0 counts | Bins with >2000 counts | High rate bins dominated by noise | Noise dominated (total time) | Noise dominated (detector-on time) | Marked lightcurve |
|---|---|---|---|---|---|---|---|
| A | 8241 | 7745 | 0 | 0 | 0.00% | 0.00% |  |
| B | 8241 | 7745 | 0 | 0 | 0.00% | 0.00% | 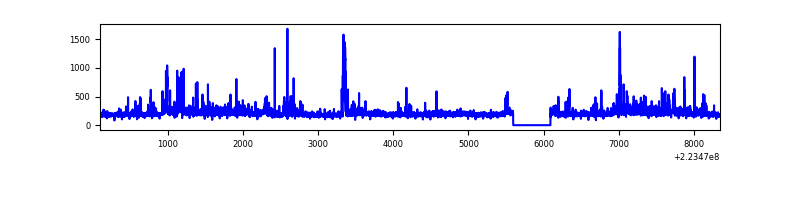 |
| C | 8241 | 7745 | 0 | 0 | 0.00% | 0.00% |  |
| D | 8241 | 7745 | 5 | 5 | 0.06% | 0.06% |  |
Top three noisy pixels from each quadrant. If the there are fewer than three noisy pixels in the level2.evt file, extra rows are filled as -1
| Pixel properties | Quadrant properties | ||||||
|---|---|---|---|---|---|---|---|
| Quadrant | DetID | PixID | Counts | Sigma | Mean | Median | Sigma |
| A | 8 | 15 | 137788 | 1641.72 | 361 | 353 | 83.7 |
| A | 3 | 1 | 6991 | 79.29 | 361 | 353 | 83.7 |
| A | 11 | 116 | 3176 | 33.72 | 361 | 353 | 83.7 |
| B | 0 | 214 | 126143 | 1713.04 | 365 | 354 | 73.4 |
| B | 4 | 81 | 77290 | 1047.74 | 365 | 354 | 73.4 |
| B | 4 | 239 | 57635 | 780.07 | 365 | 354 | 73.4 |
| C | 9 | 68 | 6000 | 68.68 | 353 | 346 | 82.3 |
| C | 1 | 3 | 2349 | 24.33 | 353 | 346 | 82.3 |
| C | 10 | 22 | 2339 | 24.21 | 353 | 346 | 82.3 |
| D | 2 | 216 | 278757 | 3213.43 | 354 | 339 | 86.6 |
| D | 2 | 33 | 127974 | 1473.13 | 354 | 339 | 86.6 |
| D | 2 | 14 | 109171 | 1256.11 | 354 | 339 | 86.6 |
Histogram calculated using DETX and DETY for each event in the final _common_clean file
| Quadrant A |  |
 |
Quadrant B |
|---|---|---|---|
| Quadrant D |  |
 |
Quadrant C |
| Plot type | Count rate plots | Images |
|---|---|---|
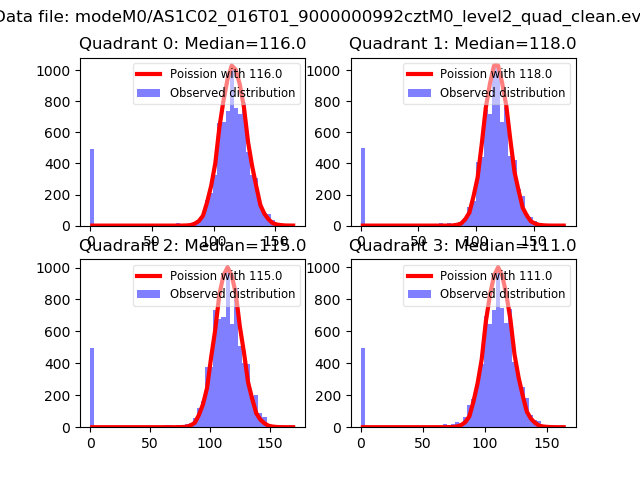
| Comparison with Poisson distribution Blue bars denote a histogram of data divided into 1 sec bins. Red curve is a Poisson curve with rate = median count rate of data. |
 |
 |
| Quadrant-wise count rates Data is divided into 100 sec bins |
 |
|
| Module-wise count rates for Quadrant A Data is divided into 100 sec bins |
 |
 |
| Module-wise count rates for Quadrant B Data is divided into 100 sec bins |
 |
 |
| Module-wise count rates for Quadrant C Data is divided into 100 sec bins |
 |
 |
| Module-wise count rates for Quadrant D Data is divided into 100 sec bins |
 |
 |
| Parameter | Plot |
|---|---|
| CZT HV Monitor |  |
| D_VDD |  |
| Temperature 1 |  |
| Veto HV Monitor |  |
| Veto LLD |  |
| Alpha Counter |  |
| _CPM_Rate | 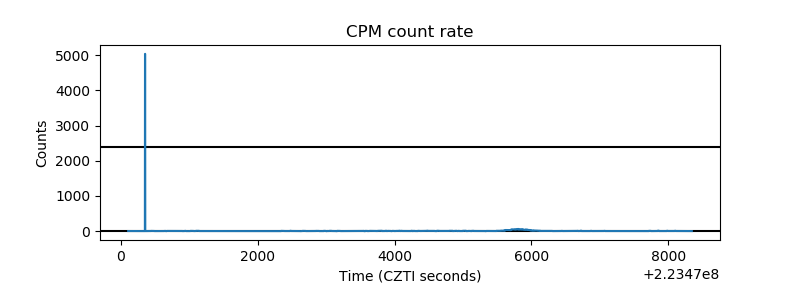 |
| CZT Counter |  |
| +2.5 Volts monitor | 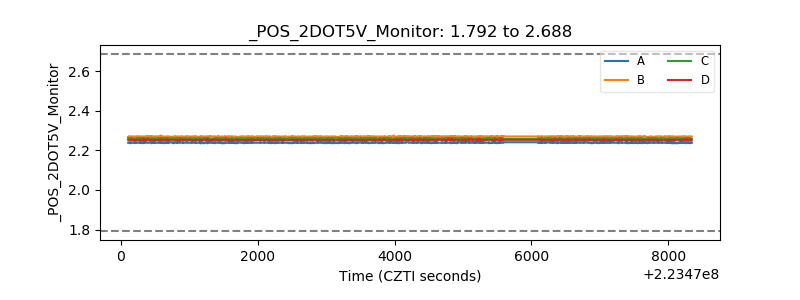 |
| +5 Volts monitor |  |
| _ROLL_ROT |  |
| _Roll_DEC |  |
| _Roll_RA |  |
| Veto Counter |  |