| Param | Original file | Final file |
|---|---|---|
| Filename | modeM0/AS1G06_036T01_9000000988cztM0_level2.evt | modeM0/AS1G06_036T01_9000000988cztM0_level2_quad_clean.evt |
| Size (bytes) | 4,009,236,480 | 654,062,400 |
| Size | 3.7 GB | 623.8 MB |
| Events in quadrant A | 26,607,230 | 3,998,285 |
| Events in quadrant B | 28,386,787 | 4,060,337 |
| Events in quadrant C | 30,947,919 | 4,050,972 |
| Events in quadrant D | 31,691,044 | 3,849,478 |
| Mode M9 | |||
|---|---|---|---|
| Quadrant | BADHDUFLAG | Total packets | Discarded packets |
| A | 0 | 68 | 0 |
| B | 0 | 68 | 0 |
| C | 0 | 68 | 0 |
| D | 0 | 68 | 0 |
| Mode SS | |||
|---|---|---|---|
| Quadrant | BADHDUFLAG | Total packets | Discarded packets |
| A | 0 | 1140 | 0 |
| B | 0 | 1140 | 0 |
| C | 0 | 1140 | 0 |
| D | 0 | 1140 | 0 |
| Mode M0 | |||
|---|---|---|---|
| Quadrant | BADHDUFLAG | Total packets | Discarded packets |
| A | 0 | 116934 | 0 |
| B | 0 | 121424 | 0 |
| C | 0 | 129833 | 0 |
| D | 0 | 133937 | 0 |
| Quadrant | Total seconds | Saturated seconds | Saturation percentage |
|---|---|---|---|
| A | 56150 | 894 | 1.592164% |
| B | 56149 | 1247 | 2.220877% |
| C | 56148 | 787 | 1.401653% |
| D | 56150 | 1322 | 2.354408% |
Noise dominated data is calculated using 1-second bins in cleaned event files. If a bin has >2000 counts, and if more than 50% of those come from <1% of pixels, then it is considered to be noise-dominated and hence unusable.
| Quadrant | # 1 sec bins | Bins with >0 counts | Bins with >2000 counts | High rate bins dominated by noise | Noise dominated (total time) | Noise dominated (detector-on time) | Marked lightcurve |
|---|---|---|---|---|---|---|---|
| A | 62930 | 56152 | 7 | 7 | 0.01% | 0.01% |  |
| B | 62930 | 56155 | 272 | 272 | 0.43% | 0.48% | 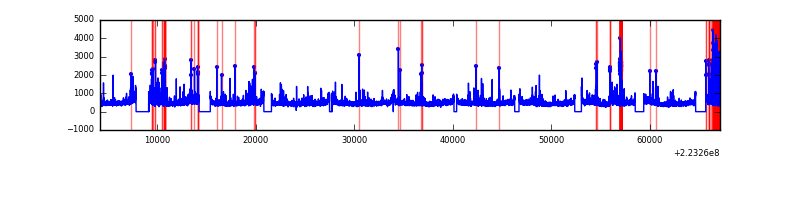 |
| C | 62930 | 56156 | 129 | 129 | 0.20% | 0.23% | 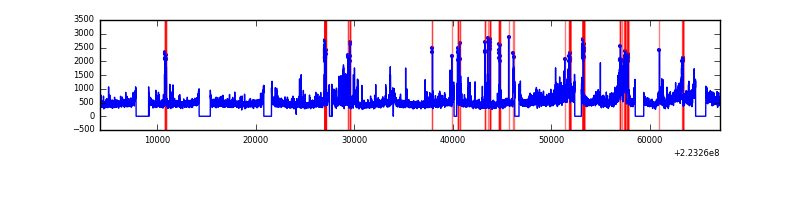 |
| D | 62930 | 56157 | 577 | 577 | 0.92% | 1.03% |  |
Top three noisy pixels from each quadrant. If the there are fewer than three noisy pixels in the level2.evt file, extra rows are filled as -1
| Pixel properties | Quadrant properties | ||||||
|---|---|---|---|---|---|---|---|
| Quadrant | DetID | PixID | Counts | Sigma | Mean | Median | Sigma |
| A | 8 | 15 | 846777 | 625.19 | 6618 | 6462 | 1344.1 |
| A | 13 | 248 | 92737 | 64.19 | 6618 | 6462 | 1344.1 |
| A | 14 | 111 | 82249 | 56.38 | 6618 | 6462 | 1344.1 |
| B | 10 | 16 | 818613 | 637.44 | 6677 | 6515 | 1274.0 |
| B | 4 | 81 | 715269 | 556.32 | 6677 | 6515 | 1274.0 |
| B | 0 | 214 | 648998 | 504.3 | 6677 | 6515 | 1274.0 |
| C | 9 | 68 | 5594771 | 3696.55 | 6478 | 6503 | 1511.8 |
| C | 13 | 61 | 49482 | 28.43 | 6478 | 6503 | 1511.8 |
| C | 12 | 4 | 29909 | 15.48 | 6478 | 6503 | 1511.8 |
| D | 2 | 216 | 3896712 | 2473.48 | 6447 | 6245 | 1572.9 |
| D | 2 | 14 | 1100234 | 695.54 | 6447 | 6245 | 1572.9 |
| D | 13 | 137 | 955068 | 603.24 | 6447 | 6245 | 1572.9 |
Histogram calculated using DETX and DETY for each event in the final _common_clean file
| Quadrant A | 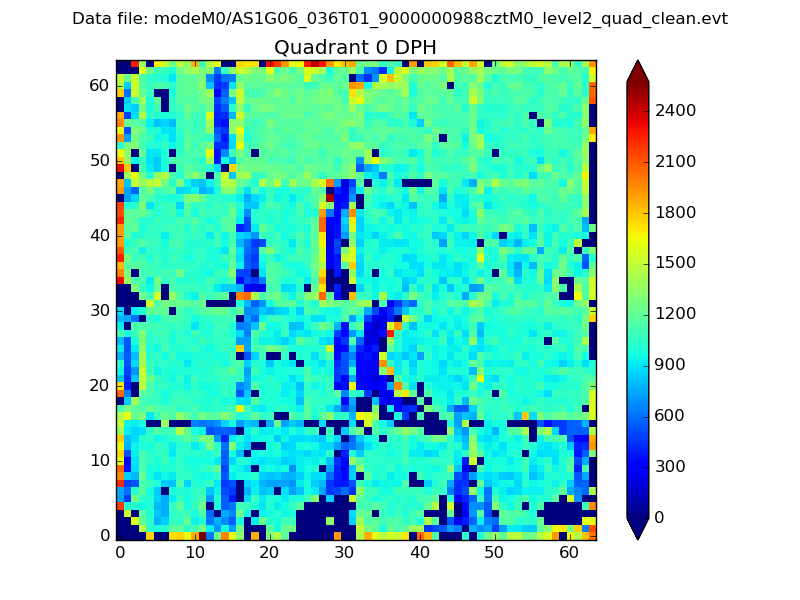 |
 |
Quadrant B |
|---|---|---|---|
| Quadrant D |  |
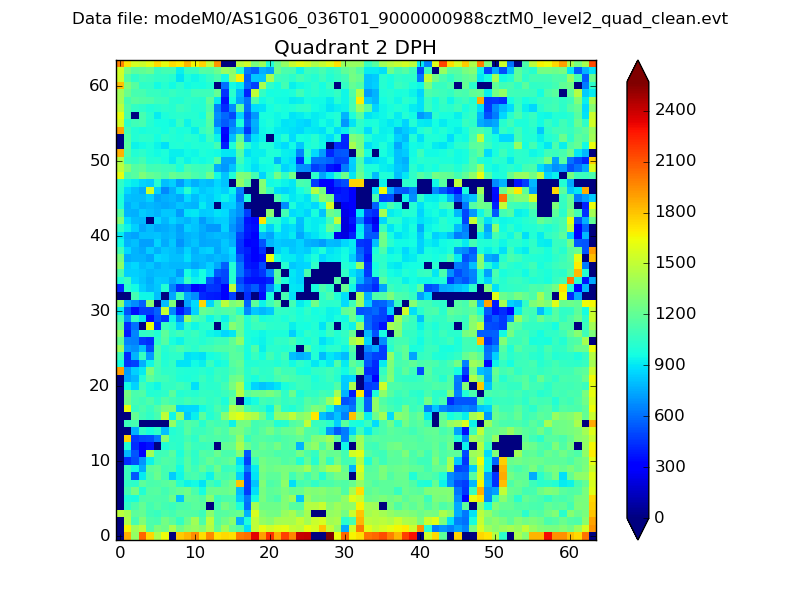 |
Quadrant C |
| Plot type | Count rate plots | Images |
|---|---|---|
| Comparison with Poisson distribution Blue bars denote a histogram of data divided into 1 sec bins. Red curve is a Poisson curve with rate = median count rate of data. |
 |
 |
| Quadrant-wise count rates Data is divided into 100 sec bins |
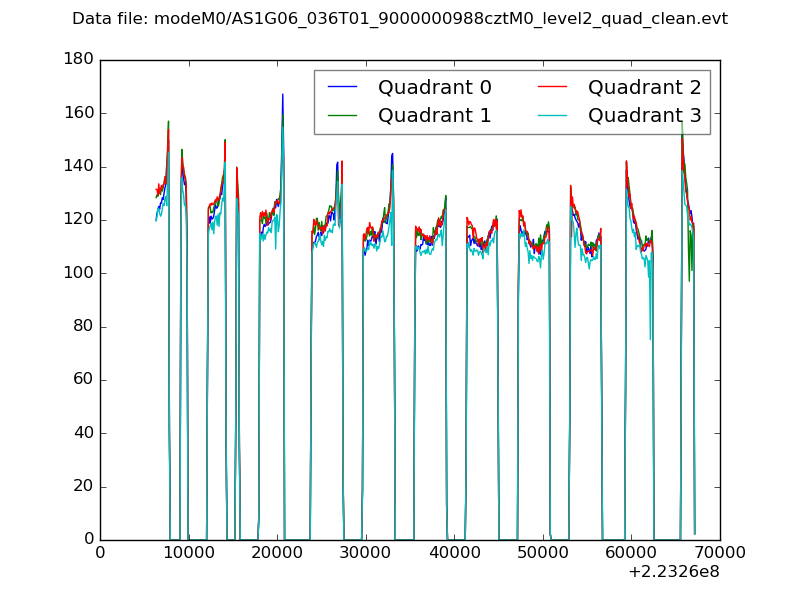 |
|
| Module-wise count rates for Quadrant A Data is divided into 100 sec bins |
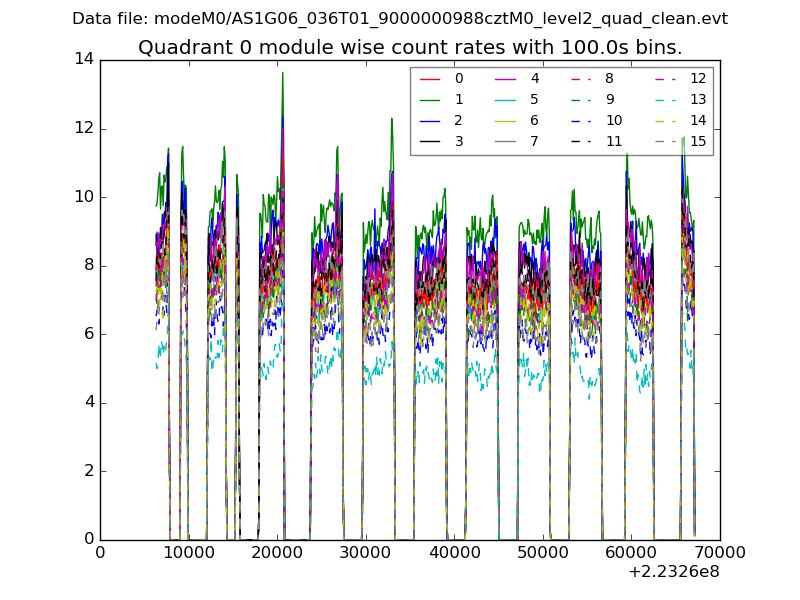 |
 |
| Module-wise count rates for Quadrant B Data is divided into 100 sec bins |
 |
 |
| Module-wise count rates for Quadrant C Data is divided into 100 sec bins |
 |
 |
| Module-wise count rates for Quadrant D Data is divided into 100 sec bins |
 |
 |
| Parameter | Plot |
|---|---|
| CZT HV Monitor |  |
| D_VDD |  |
| Temperature 1 |  |
| Veto HV Monitor |  |
| Veto LLD |  |
| Alpha Counter |  |
| _CPM_Rate | 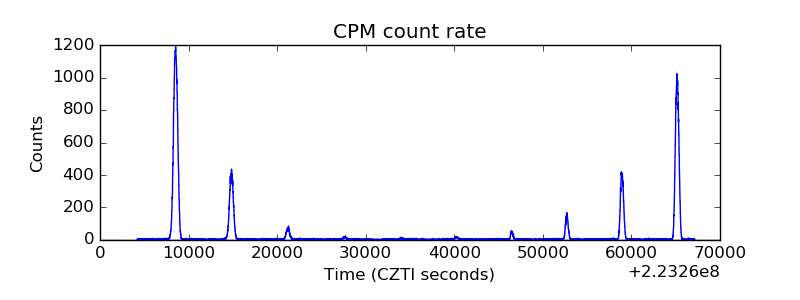 |
| CZT Counter |  |
| +2.5 Volts monitor |  |
| +5 Volts monitor |  |
| _ROLL_ROT |  |
| _Roll_DEC | 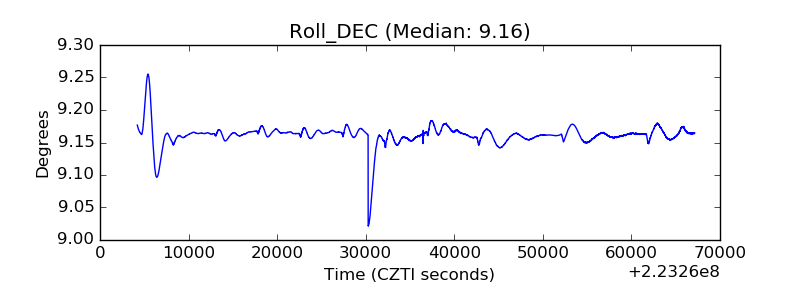 |
| _Roll_RA |  |
| Veto Counter |  |