| Param | Original file | Final file |
|---|---|---|
| Filename | modeM0/AS1G05_246T03_9000000990cztM0_level2.evt | modeM0/AS1G05_246T03_9000000990cztM0_level2_quad_clean.evt |
| Size (bytes) | 8,597,237,760 | 1,586,211,840 |
| Size | 8.0 GB | 1.5 GB |
| Events in quadrant A | 57,503,719 | 9,998,914 |
| Events in quadrant B | 64,686,777 | 10,131,092 |
| Events in quadrant C | 63,536,630 | 10,066,852 |
| Events in quadrant D | 66,441,813 | 9,517,527 |
| Mode SS | |||
|---|---|---|---|
| Quadrant | BADHDUFLAG | Total packets | Discarded packets |
| A | 0 | 2470 | 0 |
| B | 0 | 2470 | 0 |
| C | 0 | 2470 | 0 |
| D | 0 | 2470 | 0 |
| Mode M9 | |||
|---|---|---|---|
| Quadrant | BADHDUFLAG | Total packets | Discarded packets |
| A | 0 | 192 | 0 |
| B | 0 | 192 | 0 |
| C | 0 | 192 | 0 |
| D | 0 | 192 | 0 |
| Mode M0 | |||
|---|---|---|---|
| Quadrant | BADHDUFLAG | Total packets | Discarded packets |
| A | 0 | 254167 | 0 |
| B | 0 | 274680 | 0 |
| C | 0 | 274461 | 0 |
| D | 0 | 285750 | 0 |
| Quadrant | Total seconds | Saturated seconds | Saturation percentage |
|---|---|---|---|
| A | 121594 | 1624 | 1.335592% |
| B | 121602 | 3515 | 2.890577% |
| C | 121590 | 917 | 0.754174% |
| D | 121595 | 3272 | 2.690900% |
Noise dominated data is calculated using 1-second bins in cleaned event files. If a bin has >2000 counts, and if more than 50% of those come from <1% of pixels, then it is considered to be noise-dominated and hence unusable.
| Quadrant | # 1 sec bins | Bins with >0 counts | Bins with >2000 counts | High rate bins dominated by noise | Noise dominated (total time) | Noise dominated (detector-on time) | Marked lightcurve |
|---|---|---|---|---|---|---|---|
| A | 140683 | 121643 | 183 | 183 | 0.13% | 0.15% |  |
| B | 140683 | 121638 | 2033 | 2033 | 1.45% | 1.67% |  |
| C | 140683 | 121634 | 65 | 65 | 0.05% | 0.05% | 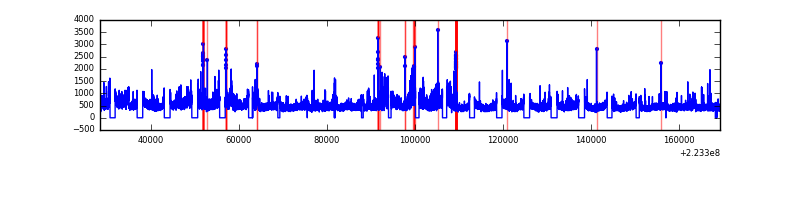 |
| D | 140683 | 121629 | 1878 | 1878 | 1.33% | 1.54% |  |
Top three noisy pixels from each quadrant. If the there are fewer than three noisy pixels in the level2.evt file, extra rows are filled as -1
| Pixel properties | Quadrant properties | ||||||
|---|---|---|---|---|---|---|---|
| Quadrant | DetID | PixID | Counts | Sigma | Mean | Median | Sigma |
| A | 8 | 15 | 1289237 | 446.66 | 14216 | 13935 | 2855.2 |
| A | 14 | 111 | 562905 | 192.27 | 14216 | 13935 | 2855.2 |
| A | 0 | 23 | 418096 | 141.55 | 14216 | 13935 | 2855.2 |
| B | 10 | 16 | 6186783 | 2321.94 | 14210 | 13878 | 2658.5 |
| B | 0 | 214 | 1402566 | 522.35 | 14210 | 13878 | 2658.5 |
| B | 4 | 81 | 770396 | 284.56 | 14210 | 13878 | 2658.5 |
| C | 9 | 68 | 9116815 | 2856.35 | 13852 | 13881 | 3186.9 |
| C | 9 | 243 | 197126 | 57.5 | 13852 | 13881 | 3186.9 |
| C | 12 | 4 | 115647 | 31.93 | 13852 | 13881 | 3186.9 |
| D | 2 | 216 | 4297643 | 1284.06 | 13685 | 13250 | 3336.6 |
| D | 2 | 14 | 3295782 | 983.8 | 13685 | 13250 | 3336.6 |
| D | 2 | 33 | 1821021 | 541.8 | 13685 | 13250 | 3336.6 |
Histogram calculated using DETX and DETY for each event in the final _common_clean file
| Quadrant A |  |
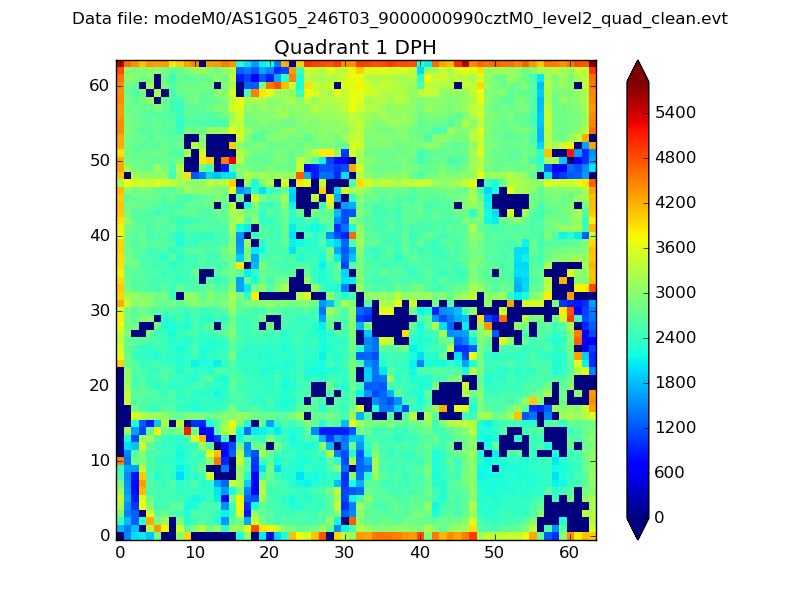 |
Quadrant B |
|---|---|---|---|
| Quadrant D |  |
 |
Quadrant C |
| Plot type | Count rate plots | Images |
|---|---|---|
| Comparison with Poisson distribution Blue bars denote a histogram of data divided into 1 sec bins. Red curve is a Poisson curve with rate = median count rate of data. |
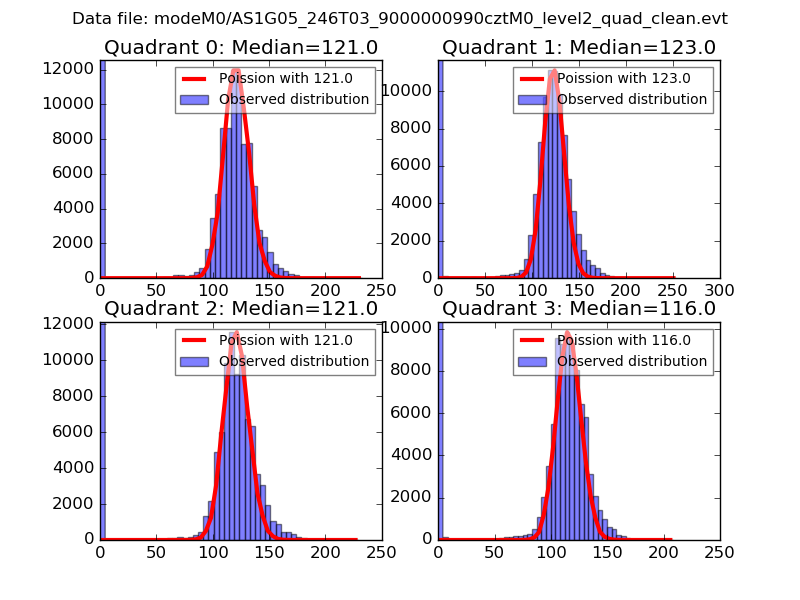 |
 |
| Quadrant-wise count rates Data is divided into 100 sec bins |
 |
|
| Module-wise count rates for Quadrant A Data is divided into 100 sec bins |
 |
 |
| Module-wise count rates for Quadrant B Data is divided into 100 sec bins |
 |
 |
| Module-wise count rates for Quadrant C Data is divided into 100 sec bins |
 |
 |
| Module-wise count rates for Quadrant D Data is divided into 100 sec bins |
 |
 |
| Parameter | Plot |
|---|---|
| CZT HV Monitor |  |
| D_VDD |  |
| Temperature 1 |  |
| Veto HV Monitor |  |
| Veto LLD |  |
| Alpha Counter |  |
| _CPM_Rate |  |
| CZT Counter |  |
| +2.5 Volts monitor |  |
| +5 Volts monitor |  |
| _ROLL_ROT |  |
| _Roll_DEC |  |
| _Roll_RA |  |
| Veto Counter |  |