| Param | Original file | Final file |
|---|---|---|
| Filename | modeM0/AS1G06_083T01_9000000984cztM0_level2.evt | modeM0/AS1G06_083T01_9000000984cztM0_level2_quad_clean.evt |
| Size (bytes) | 4,915,284,480 | 1,038,856,320 |
| Size | 4.6 GB | 990.7 MB |
| Events in quadrant A | 32,683,931 | 6,779,583 |
| Events in quadrant B | 36,137,451 | 6,933,214 |
| Events in quadrant C | 31,847,571 | 6,745,179 |
| Events in quadrant D | 43,589,503 | 6,331,074 |
| Mode SS | |||
|---|---|---|---|
| Quadrant | BADHDUFLAG | Total packets | Discarded packets |
| A | 0 | 1382 | 0 |
| B | 0 | 1382 | 0 |
| C | 0 | 1382 | 0 |
| D | 0 | 1382 | 0 |
| Mode M0 | |||
|---|---|---|---|
| Quadrant | BADHDUFLAG | Total packets | Discarded packets |
| A | 0 | 144553 | 0 |
| B | 0 | 153084 | 0 |
| C | 0 | 142932 | 0 |
| D | 0 | 175395 | 0 |
| Mode M9 | |||
|---|---|---|---|
| Quadrant | BADHDUFLAG | Total packets | Discarded packets |
| A | 0 | 99 | 0 |
| B | 0 | 99 | 0 |
| C | 0 | 99 | 0 |
| D | 0 | 99 | 0 |
| Quadrant | Total seconds | Saturated seconds | Saturation percentage |
|---|---|---|---|
| A | 68232 | 1192 | 1.746981% |
| B | 68232 | 1868 | 2.737718% |
| C | 68232 | 905 | 1.326357% |
| D | 68232 | 2574 | 3.772423% |
Noise dominated data is calculated using 1-second bins in cleaned event files. If a bin has >2000 counts, and if more than 50% of those come from <1% of pixels, then it is considered to be noise-dominated and hence unusable.
| Quadrant | # 1 sec bins | Bins with >0 counts | Bins with >2000 counts | High rate bins dominated by noise | Noise dominated (total time) | Noise dominated (detector-on time) | Marked lightcurve |
|---|---|---|---|---|---|---|---|
| A | 78027 | 68237 | 135 | 135 | 0.17% | 0.20% |  |
| B | 78027 | 68238 | 505 | 505 | 0.65% | 0.74% |  |
| C | 78027 | 68237 | 181 | 181 | 0.23% | 0.27% |  |
| D | 78027 | 68236 | 1368 | 1368 | 1.75% | 2.00% |  |
Top three noisy pixels from each quadrant. If the there are fewer than three noisy pixels in the level2.evt file, extra rows are filled as -1
| Pixel properties | Quadrant properties | ||||||
|---|---|---|---|---|---|---|---|
| Quadrant | DetID | PixID | Counts | Sigma | Mean | Median | Sigma |
| A | 8 | 15 | 1377631 | 858.51 | 7985 | 7832 | 1595.5 |
| A | 13 | 248 | 223899 | 135.42 | 7985 | 7832 | 1595.5 |
| A | 14 | 14 | 121101 | 70.99 | 7985 | 7832 | 1595.5 |
| B | 0 | 228 | 1183058 | 789.5 | 8017 | 7826 | 1488.6 |
| B | 0 | 214 | 1103786 | 736.25 | 8017 | 7826 | 1488.6 |
| B | 10 | 16 | 997975 | 665.16 | 8017 | 7826 | 1488.6 |
| C | 9 | 243 | 999583 | 553.28 | 7797 | 7822 | 1792.5 |
| C | 9 | 68 | 354632 | 193.48 | 7797 | 7822 | 1792.5 |
| C | 13 | 61 | 60191 | 29.22 | 7797 | 7822 | 1792.5 |
| D | 2 | 216 | 5087558 | 2710.68 | 7718 | 7487 | 1874.1 |
| D | 8 | 195 | 3736477 | 1989.76 | 7718 | 7487 | 1874.1 |
| D | 2 | 63 | 1887493 | 1003.15 | 7718 | 7487 | 1874.1 |
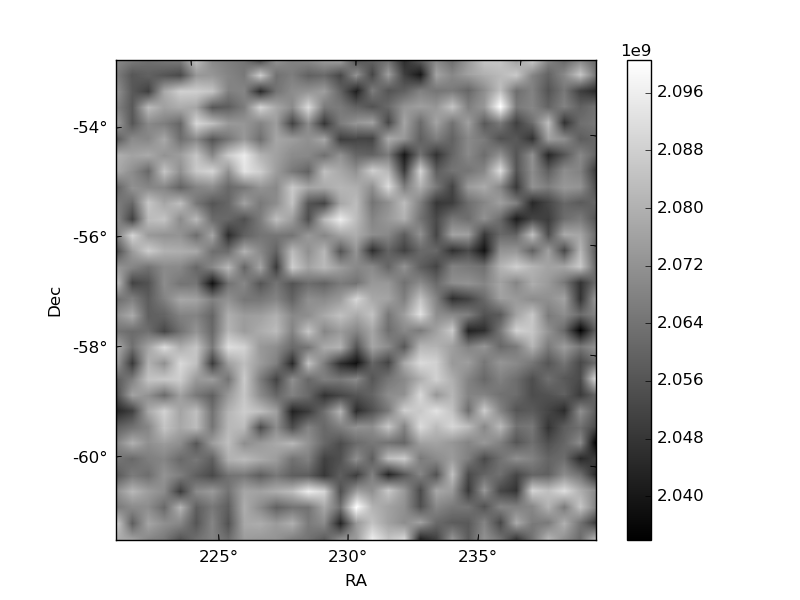
Histogram calculated using DETX and DETY for each event in the final _common_clean file
| Quadrant A |  |
 |
Quadrant B |
|---|---|---|---|
| Quadrant D |  |
 |
Quadrant C |
| Plot type | Count rate plots | Images |
|---|---|---|
| Comparison with Poisson distribution Blue bars denote a histogram of data divided into 1 sec bins. Red curve is a Poisson curve with rate = median count rate of data. |
 |
 |
| Quadrant-wise count rates Data is divided into 100 sec bins |
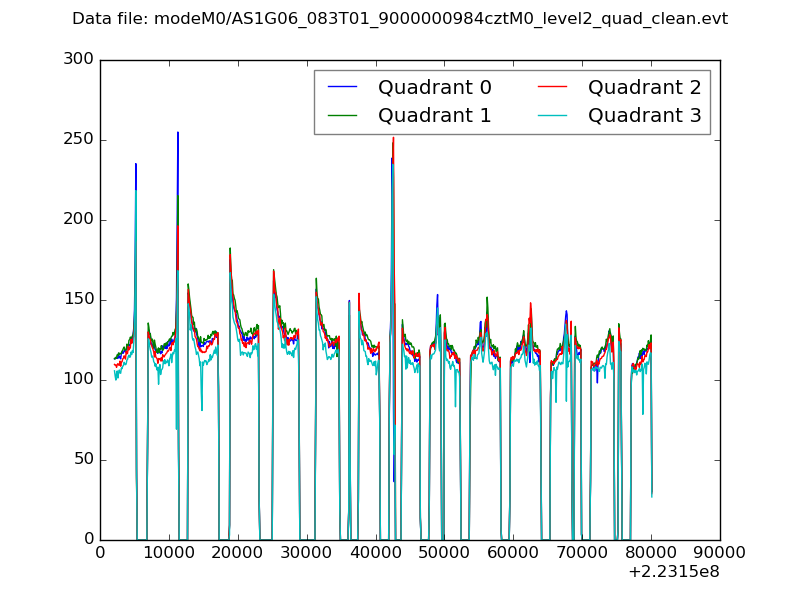 |
|
| Module-wise count rates for Quadrant A Data is divided into 100 sec bins |
 |
 |
| Module-wise count rates for Quadrant B Data is divided into 100 sec bins |
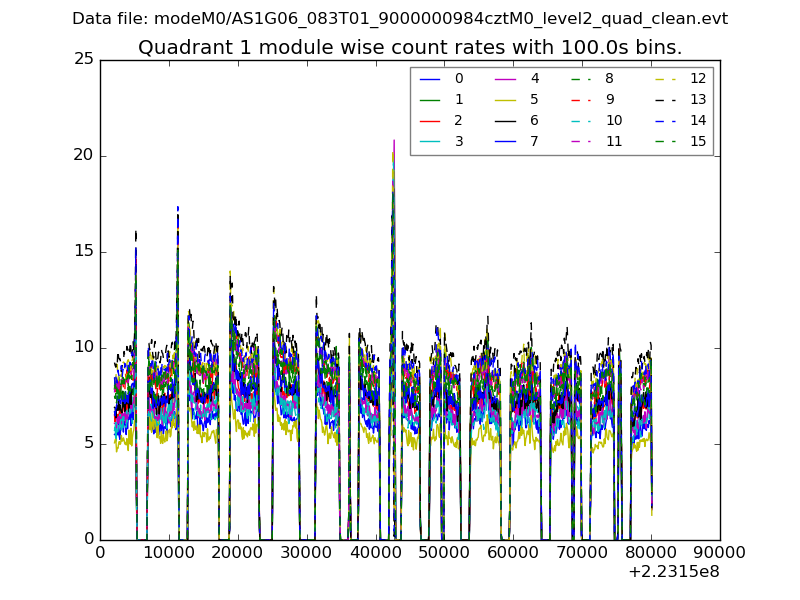 |
 |
| Module-wise count rates for Quadrant C Data is divided into 100 sec bins |
 |
 |
| Module-wise count rates for Quadrant D Data is divided into 100 sec bins |
 |
 |
| Parameter | Plot |
|---|---|
| CZT HV Monitor |  |
| D_VDD |  |
| Temperature 1 |  |
| Veto HV Monitor |  |
| Veto LLD |  |
| Alpha Counter |  |
| _CPM_Rate |  |
| CZT Counter |  |
| +2.5 Volts monitor |  |
| +5 Volts monitor |  |
| _ROLL_ROT | 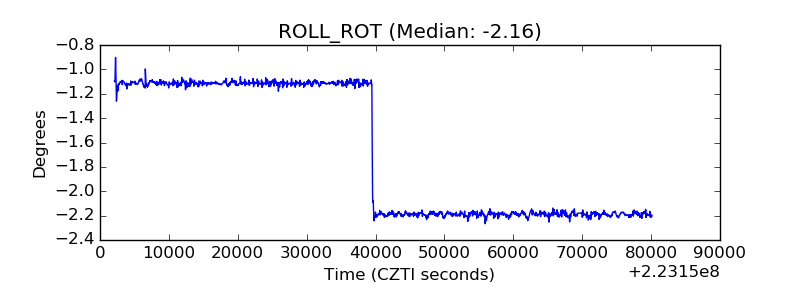 |
| _Roll_DEC |  |
| _Roll_RA |  |
| Veto Counter | 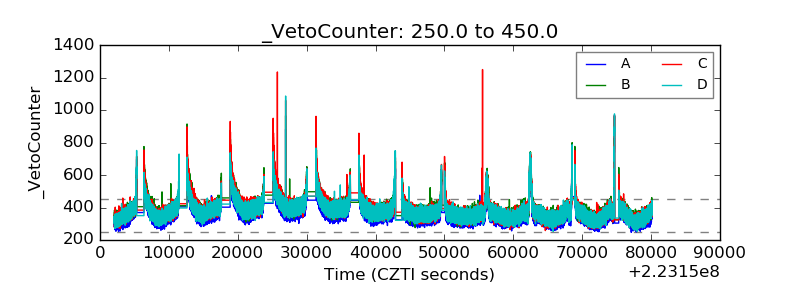 |