| Param | Original file | Final file |
|---|---|---|
| Filename | modeM0/AS1A02_176T01_9000000980cztM0_level2.evt | modeM0/AS1A02_176T01_9000000980cztM0_level2_quad_clean.evt |
| Size (bytes) | 4,272,217,920 | 1,067,405,760 |
| Size | 4.0 GB | 1018.0 MB |
| Events in quadrant A | 27,710,553 | 7,113,134 |
| Events in quadrant B | 29,554,742 | 7,271,604 |
| Events in quadrant C | 26,601,650 | 7,128,138 |
| Events in quadrant D | 41,431,101 | 6,666,231 |
| Mode SS | |||
|---|---|---|---|
| Quadrant | BADHDUFLAG | Total packets | Discarded packets |
| A | 0 | 1234 | 0 |
| B | 0 | 1234 | 0 |
| C | 0 | 1234 | 0 |
| D | 0 | 1234 | 0 |
| Mode M0 | |||
|---|---|---|---|
| Quadrant | BADHDUFLAG | Total packets | Discarded packets |
| A | 0 | 125455 | 0 |
| B | 0 | 128330 | 0 |
| C | 0 | 123528 | 0 |
| D | 0 | 164584 | 0 |
| Mode M9 | |||
|---|---|---|---|
| Quadrant | BADHDUFLAG | Total packets | Discarded packets |
| A | 0 | 77 | 0 |
| B | 0 | 77 | 0 |
| C | 0 | 77 | 0 |
| D | 0 | 77 | 0 |
| Quadrant | Total seconds | Saturated seconds | Saturation percentage |
|---|---|---|---|
| A | 60553 | 1258 | 2.077519% |
| B | 60553 | 1107 | 1.828151% |
| C | 60553 | 719 | 1.187390% |
| D | 60553 | 2533 | 4.183112% |
Noise dominated data is calculated using 1-second bins in cleaned event files. If a bin has >2000 counts, and if more than 50% of those come from <1% of pixels, then it is considered to be noise-dominated and hence unusable.
| Quadrant | # 1 sec bins | Bins with >0 counts | Bins with >2000 counts | High rate bins dominated by noise | Noise dominated (total time) | Noise dominated (detector-on time) | Marked lightcurve |
|---|---|---|---|---|---|---|---|
| A | 68419 | 60557 | 34 | 34 | 0.05% | 0.06% |  |
| B | 68419 | 60558 | 45 | 45 | 0.07% | 0.07% |  |
| C | 68419 | 60562 | 2 | 2 | 0.00% | 0.00% |  |
| D | 68419 | 60559 | 1355 | 1355 | 1.98% | 2.24% | 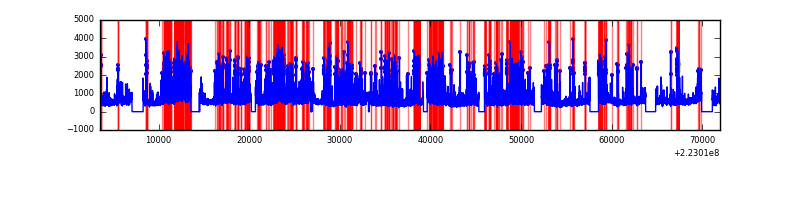 |
Top three noisy pixels from each quadrant. If the there are fewer than three noisy pixels in the level2.evt file, extra rows are filled as -1
| Pixel properties | Quadrant properties | ||||||
|---|---|---|---|---|---|---|---|
| Quadrant | DetID | PixID | Counts | Sigma | Mean | Median | Sigma |
| A | 14 | 111 | 488931 | 343.94 | 6941 | 6781 | 1401.9 |
| A | 8 | 15 | 127061 | 85.8 | 6941 | 6781 | 1401.9 |
| A | 13 | 248 | 119736 | 80.58 | 6941 | 6781 | 1401.9 |
| B | 0 | 214 | 819658 | 616.62 | 7041 | 6869 | 1318.1 |
| B | 0 | 219 | 589379 | 441.92 | 7041 | 6869 | 1318.1 |
| B | 4 | 81 | 365362 | 271.97 | 7041 | 6869 | 1318.1 |
| C | 13 | 61 | 53534 | 29.97 | 6790 | 6793 | 1559.6 |
| C | 8 | 128 | 41110 | 22.0 | 6790 | 6793 | 1559.6 |
| C | 8 | 112 | 26476 | 12.62 | 6790 | 6793 | 1559.6 |
| D | 8 | 195 | 5856135 | 3587.53 | 6690 | 6462 | 1630.6 |
| D | 2 | 216 | 5507751 | 3373.87 | 6690 | 6462 | 1630.6 |
| D | 14 | 34 | 2567814 | 1570.85 | 6690 | 6462 | 1630.6 |
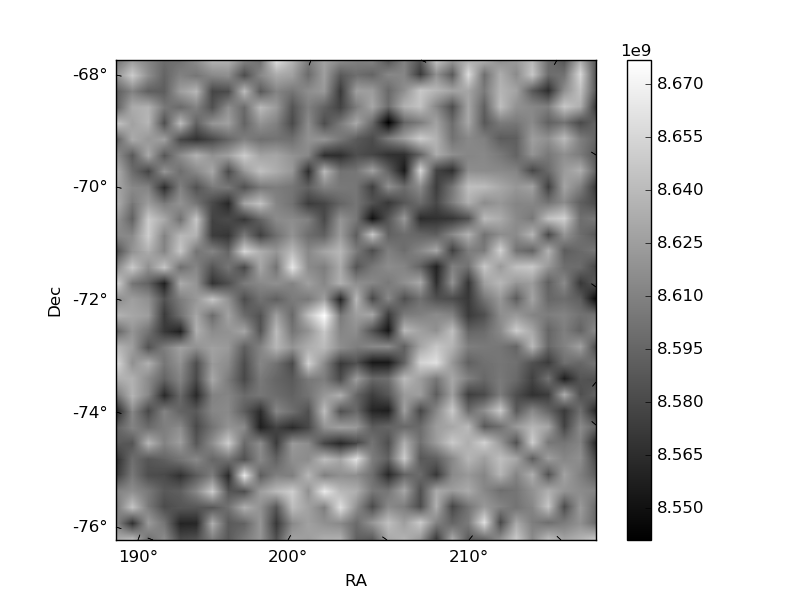
Histogram calculated using DETX and DETY for each event in the final _common_clean file
| Quadrant A |  |
 |
Quadrant B |
|---|---|---|---|
| Quadrant D |  |
 |
Quadrant C |
| Plot type | Count rate plots | Images |
|---|---|---|
| Comparison with Poisson distribution Blue bars denote a histogram of data divided into 1 sec bins. Red curve is a Poisson curve with rate = median count rate of data. |
 |
 |
| Quadrant-wise count rates Data is divided into 100 sec bins |
 |
|
| Module-wise count rates for Quadrant A Data is divided into 100 sec bins |
 |
 |
| Module-wise count rates for Quadrant B Data is divided into 100 sec bins |
 |
 |
| Module-wise count rates for Quadrant C Data is divided into 100 sec bins |
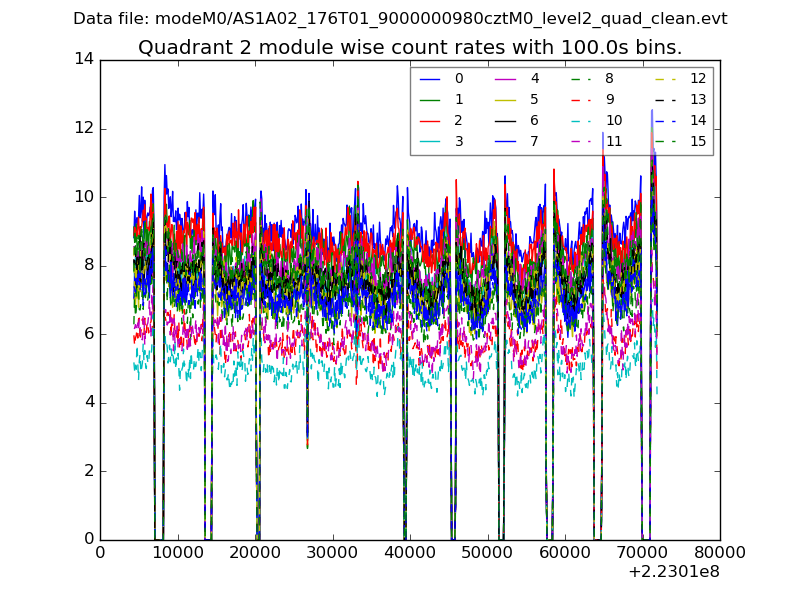 |
 |
| Module-wise count rates for Quadrant D Data is divided into 100 sec bins |
 |
 |
| Parameter | Plot |
|---|---|
| CZT HV Monitor |  |
| D_VDD |  |
| Temperature 1 |  |
| Veto HV Monitor |  |
| Veto LLD | 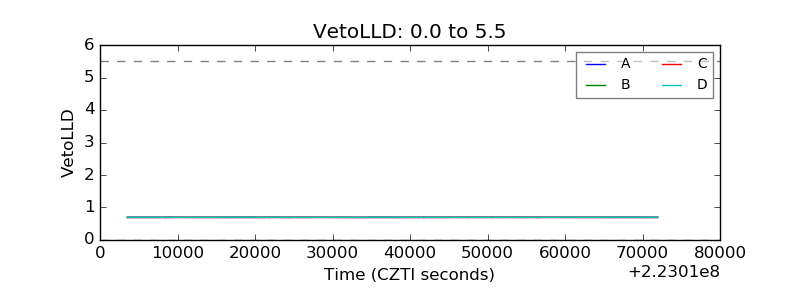 |
| Alpha Counter | 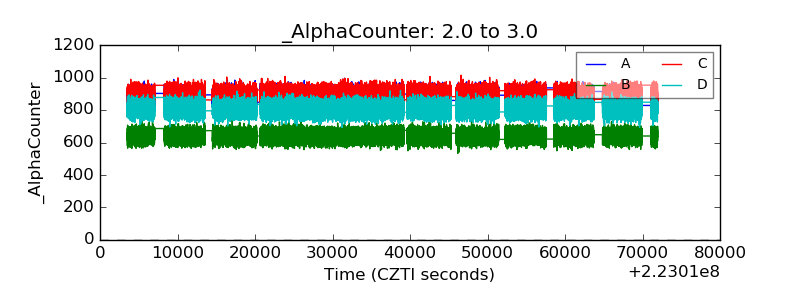 |
| _CPM_Rate |  |
| CZT Counter |  |
| +2.5 Volts monitor | 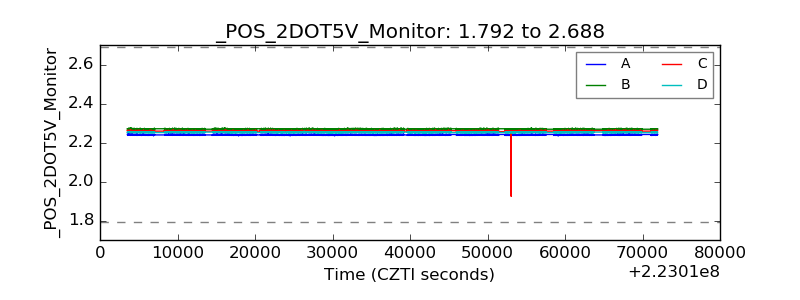 |
| +5 Volts monitor | 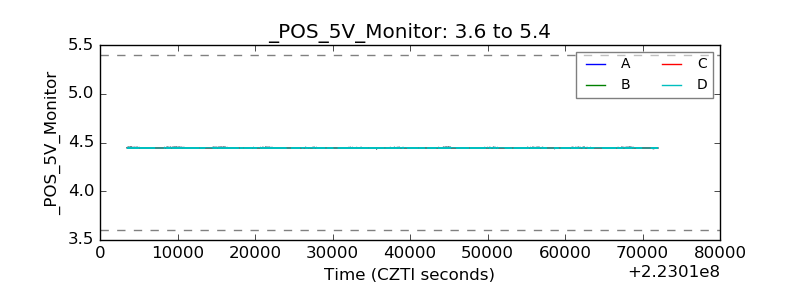 |
| _ROLL_ROT | 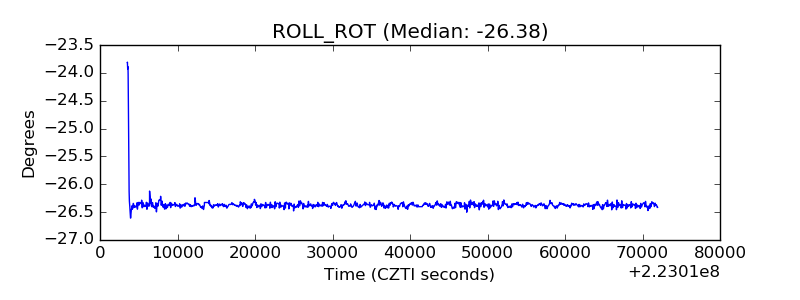 |
| _Roll_DEC |  |
| _Roll_RA |  |
| Veto Counter | 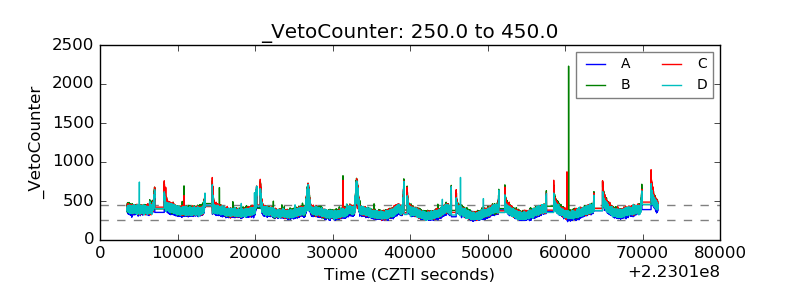 |