| Param | Original file | Final file |
|---|---|---|
| Filename | modeM0/AS1A02_073T02_9000000982cztM0_level2.evt | modeM0/AS1A02_073T02_9000000982cztM0_level2_quad_clean.evt |
| Size (bytes) | 3,416,610,240 | 566,055,360 |
| Size | 3.2 GB | 539.8 MB |
| Events in quadrant A | 22,667,053 | 3,481,395 |
| Events in quadrant B | 24,200,359 | 3,552,045 |
| Events in quadrant C | 22,523,004 | 3,499,637 |
| Events in quadrant D | 30,829,108 | 3,302,990 |
| Mode M0 | |||
|---|---|---|---|
| Quadrant | BADHDUFLAG | Total packets | Discarded packets |
| A | 0 | 99732 | 0 |
| B | 0 | 103492 | 0 |
| C | 0 | 100081 | 0 |
| D | 0 | 125068 | 0 |
| Mode M9 | |||
|---|---|---|---|
| Quadrant | BADHDUFLAG | Total packets | Discarded packets |
| A | 0 | 85 | 0 |
| B | 0 | 84 | 0 |
| C | 0 | 84 | 0 |
| D | 0 | 84 | 0 |
| Mode SS | |||
|---|---|---|---|
| Quadrant | BADHDUFLAG | Total packets | Discarded packets |
| A | 0 | 982 | 0 |
| B | 0 | 982 | 0 |
| C | 0 | 982 | 0 |
| D | 0 | 982 | 0 |
| Quadrant | Total seconds | Saturated seconds | Saturation percentage |
|---|---|---|---|
| A | 48217 | 732 | 1.518137% |
| B | 48217 | 782 | 1.621835% |
| C | 48217 | 494 | 1.024535% |
| D | 48216 | 1711 | 3.548615% |
Noise dominated data is calculated using 1-second bins in cleaned event files. If a bin has >2000 counts, and if more than 50% of those come from <1% of pixels, then it is considered to be noise-dominated and hence unusable.
| Quadrant | # 1 sec bins | Bins with >0 counts | Bins with >2000 counts | High rate bins dominated by noise | Noise dominated (total time) | Noise dominated (detector-on time) | Marked lightcurve |
|---|---|---|---|---|---|---|---|
| A | 68178 | 48221 | 24 | 24 | 0.04% | 0.05% |  |
| B | 68178 | 48219 | 45 | 45 | 0.07% | 0.09% |  |
| C | 68178 | 48221 | 10 | 10 | 0.01% | 0.02% |  |
| D | 68177 | 48218 | 975 | 975 | 1.43% | 2.02% |  |
Top three noisy pixels from each quadrant. If the there are fewer than three noisy pixels in the level2.evt file, extra rows are filled as -1
| Pixel properties | Quadrant properties | ||||||
|---|---|---|---|---|---|---|---|
| Quadrant | DetID | PixID | Counts | Sigma | Mean | Median | Sigma |
| A | 14 | 111 | 243661 | 202.13 | 5783 | 5664 | 1177.5 |
| A | 0 | 226 | 54677 | 41.63 | 5783 | 5664 | 1177.5 |
| A | 12 | 194 | 52209 | 39.53 | 5783 | 5664 | 1177.5 |
| B | 0 | 214 | 685651 | 616.48 | 5817 | 5687 | 1103.0 |
| B | 0 | 219 | 395248 | 353.19 | 5817 | 5687 | 1103.0 |
| B | 4 | 81 | 217762 | 192.28 | 5817 | 5687 | 1103.0 |
| C | 9 | 68 | 467443 | 353.5 | 5626 | 5644 | 1306.4 |
| C | 13 | 250 | 92218 | 66.27 | 5626 | 5644 | 1306.4 |
| C | 13 | 61 | 44105 | 29.44 | 5626 | 5644 | 1306.4 |
| D | 8 | 195 | 3470518 | 2548.42 | 5572 | 5401 | 1359.7 |
| D | 2 | 216 | 2605966 | 1912.59 | 5572 | 5401 | 1359.7 |
| D | 2 | 14 | 1523094 | 1116.19 | 5572 | 5401 | 1359.7 |
Histogram calculated using DETX and DETY for each event in the final _common_clean file
| Quadrant A |  |
 |
Quadrant B |
|---|---|---|---|
| Quadrant D | 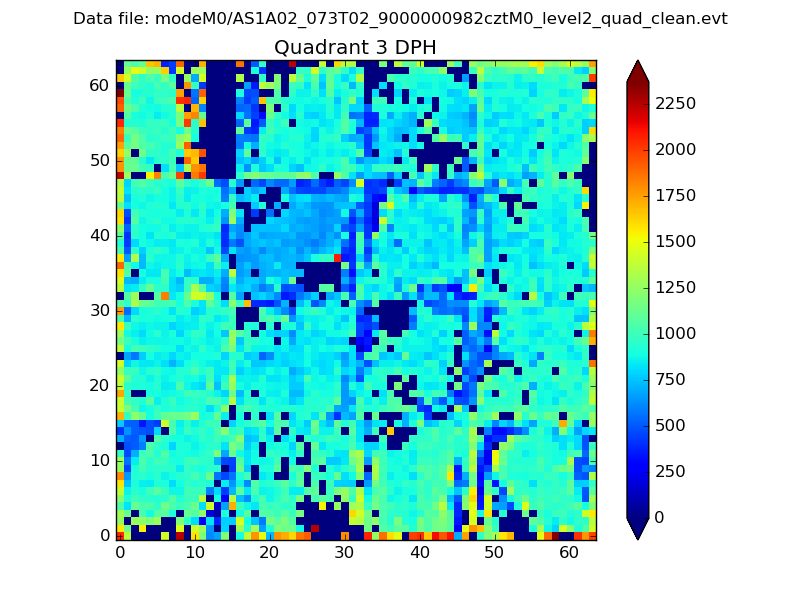 |
 |
Quadrant C |
| Plot type | Count rate plots | Images |
|---|---|---|
| Comparison with Poisson distribution Blue bars denote a histogram of data divided into 1 sec bins. Red curve is a Poisson curve with rate = median count rate of data. |
 |
 |
| Quadrant-wise count rates Data is divided into 100 sec bins |
 |
|
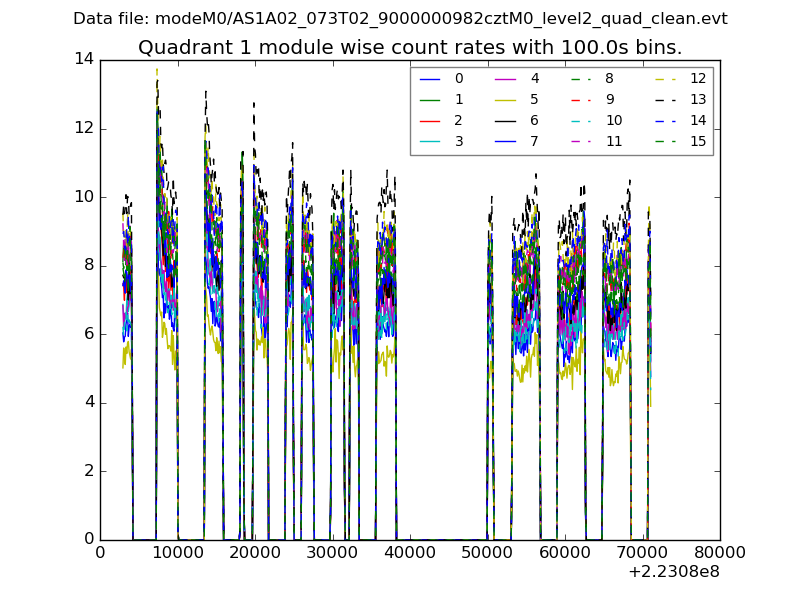
| Module-wise count rates for Quadrant A Data is divided into 100 sec bins |
 |
 |
| Module-wise count rates for Quadrant B Data is divided into 100 sec bins |
 |
 |
| Module-wise count rates for Quadrant C Data is divided into 100 sec bins |
 |
 |
| Module-wise count rates for Quadrant D Data is divided into 100 sec bins |
 |
 |
| Parameter | Plot |
|---|---|
| CZT HV Monitor |  |
| D_VDD |  |
| Temperature 1 |  |
| Veto HV Monitor |  |
| Veto LLD |  |
| Alpha Counter |  |
| _CPM_Rate |  |
| CZT Counter |  |
| +2.5 Volts monitor |  |
| +5 Volts monitor |  |
| _ROLL_ROT |  |
| _Roll_DEC |  |
| _Roll_RA |  |
| Veto Counter |  |