| Param | Original file | Final file |
|---|---|---|
| Filename | modeM0/AS1G06_102T01_9000000978cztM0_level2.evt | modeM0/AS1G06_102T01_9000000978cztM0_level2_quad_clean.evt |
| Size (bytes) | 3,313,615,680 | 550,512,000 |
| Size | 3.1 GB | 525.0 MB |
| Events in quadrant A | 22,374,889 | 3,412,649 |
| Events in quadrant B | 22,200,898 | 3,511,473 |
| Events in quadrant C | 20,859,071 | 3,450,094 |
| Events in quadrant D | 31,871,708 | 3,199,243 |
| Mode SS | |||
|---|---|---|---|
| Quadrant | BADHDUFLAG | Total packets | Discarded packets |
| A | 0 | 926 | 0 |
| B | 0 | 924 | 0 |
| C | 0 | 924 | 0 |
| D | 0 | 926 | 0 |
| Mode M0 | |||
|---|---|---|---|
| Quadrant | BADHDUFLAG | Total packets | Discarded packets |
| A | 0 | 97443 | 0 |
| B | 0 | 96673 | 0 |
| C | 0 | 94102 | 0 |
| D | 0 | 124674 | 0 |
| Mode M9 | |||
|---|---|---|---|
| Quadrant | BADHDUFLAG | Total packets | Discarded packets |
| A | 0 | 88 | 0 |
| B | 0 | 88 | 0 |
| C | 0 | 88 | 0 |
| D | 0 | 88 | 0 |
| Quadrant | Total seconds | Saturated seconds | Saturation percentage |
|---|---|---|---|
| A | 45157 | 518 | 1.147109% |
| B | 45155 | 447 | 0.989924% |
| C | 45159 | 325 | 0.719679% |
| D | 45158 | 2317 | 5.130874% |
Noise dominated data is calculated using 1-second bins in cleaned event files. If a bin has >2000 counts, and if more than 50% of those come from <1% of pixels, then it is considered to be noise-dominated and hence unusable.
| Quadrant | # 1 sec bins | Bins with >0 counts | Bins with >2000 counts | High rate bins dominated by noise | Noise dominated (total time) | Noise dominated (detector-on time) | Marked lightcurve |
|---|---|---|---|---|---|---|---|
| A | 74180 | 45187 | 115 | 115 | 0.16% | 0.25% |  |
| B | 74181 | 45185 | 30 | 30 | 0.04% | 0.07% | 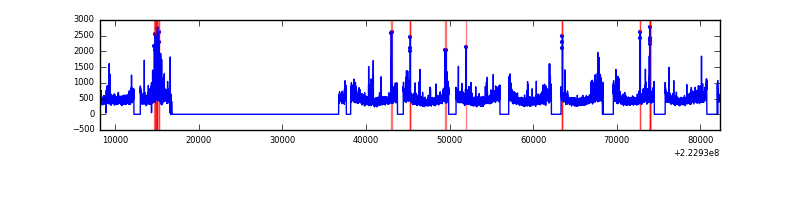 |
| C | 74181 | 45188 | 84 | 84 | 0.11% | 0.19% |  |
| D | 74181 | 45190 | 2003 | 2003 | 2.70% | 4.43% |  |
Top three noisy pixels from each quadrant. If the there are fewer than three noisy pixels in the level2.evt file, extra rows are filled as -1
| Pixel properties | Quadrant properties | ||||||
|---|---|---|---|---|---|---|---|
| Quadrant | DetID | PixID | Counts | Sigma | Mean | Median | Sigma |
| A | 8 | 15 | 1261311 | 1185.6 | 5259 | 5148 | 1059.5 |
| A | 14 | 238 | 739744 | 693.33 | 5259 | 5148 | 1059.5 |
| A | 14 | 111 | 96873 | 86.57 | 5259 | 5148 | 1059.5 |
| B | 0 | 214 | 531209 | 531.39 | 5316 | 5195 | 989.9 |
| B | 0 | 219 | 319521 | 317.54 | 5316 | 5195 | 989.9 |
| B | 15 | 204 | 210118 | 207.02 | 5316 | 5195 | 989.9 |
| C | 4 | 254 | 690927 | 584.38 | 5110 | 5124 | 1173.5 |
| C | 9 | 68 | 193621 | 160.62 | 5110 | 5124 | 1173.5 |
| C | 13 | 61 | 39763 | 29.52 | 5110 | 5124 | 1173.5 |
| D | 12 | 221 | 3697199 | 3035.68 | 5017 | 4863 | 1216.3 |
| D | 2 | 216 | 3365182 | 2762.71 | 5017 | 4863 | 1216.3 |
| D | 12 | 233 | 2702063 | 2217.52 | 5017 | 4863 | 1216.3 |
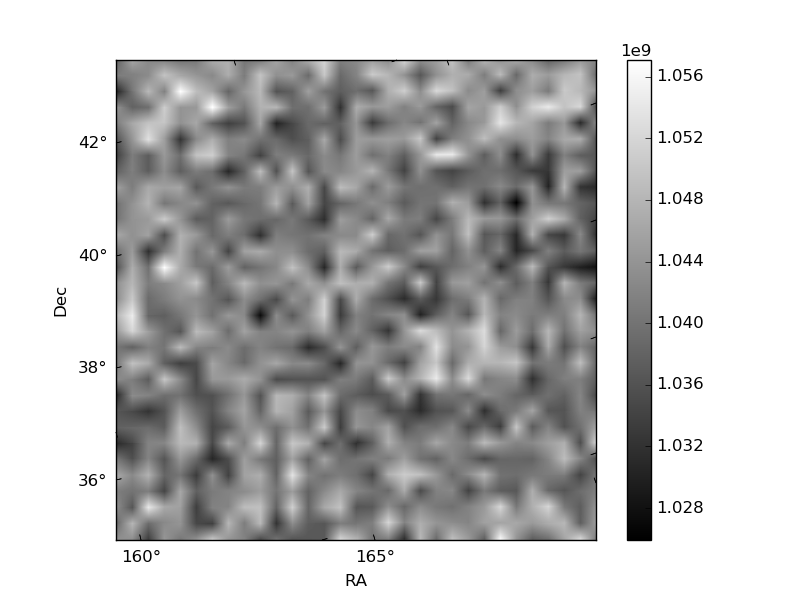
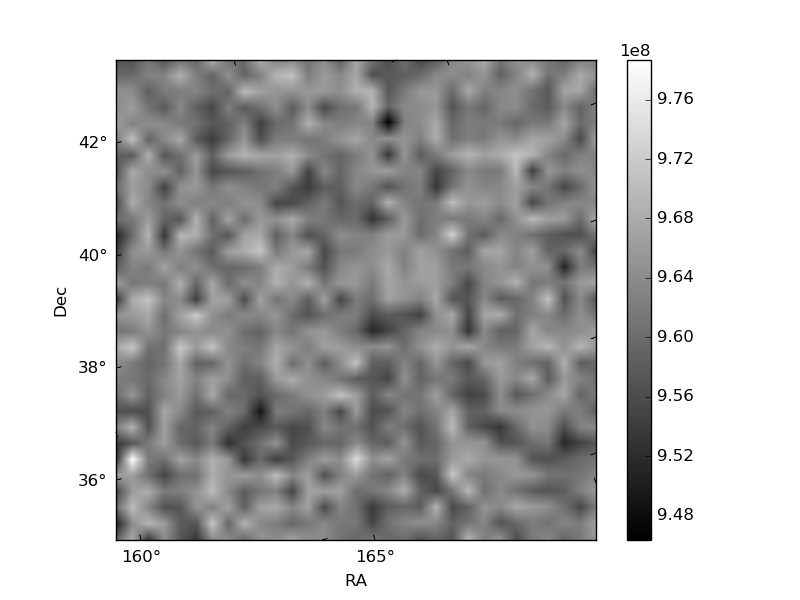
Histogram calculated using DETX and DETY for each event in the final _common_clean file
| Quadrant A |  |
 |
Quadrant B |
|---|---|---|---|
| Quadrant D |  |
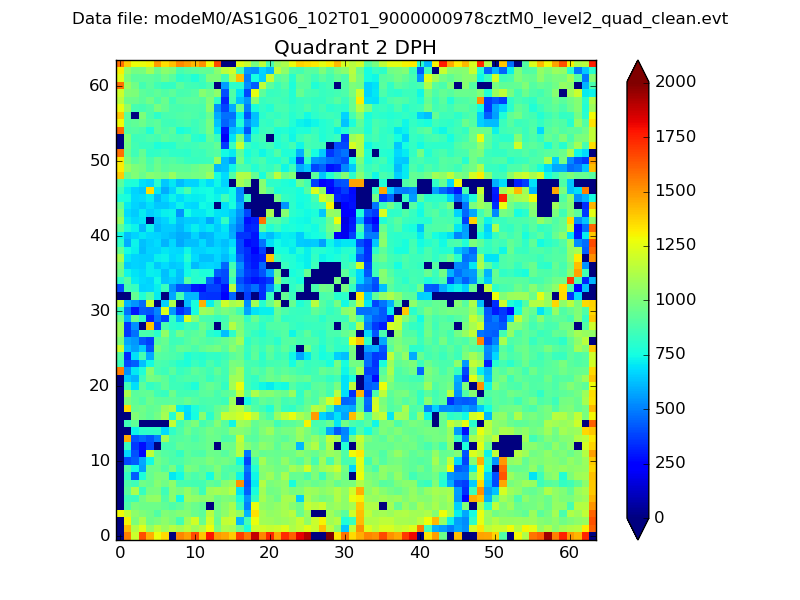 |
Quadrant C |
| Plot type | Count rate plots | Images |
|---|---|---|
| Comparison with Poisson distribution Blue bars denote a histogram of data divided into 1 sec bins. Red curve is a Poisson curve with rate = median count rate of data. |
 |
 |
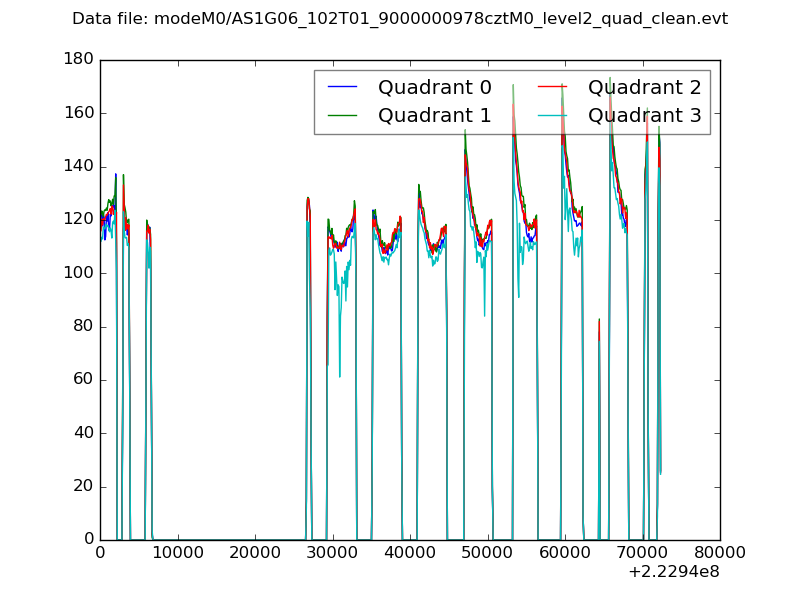
| Quadrant-wise count rates Data is divided into 100 sec bins |
 |
|
| Module-wise count rates for Quadrant A Data is divided into 100 sec bins |
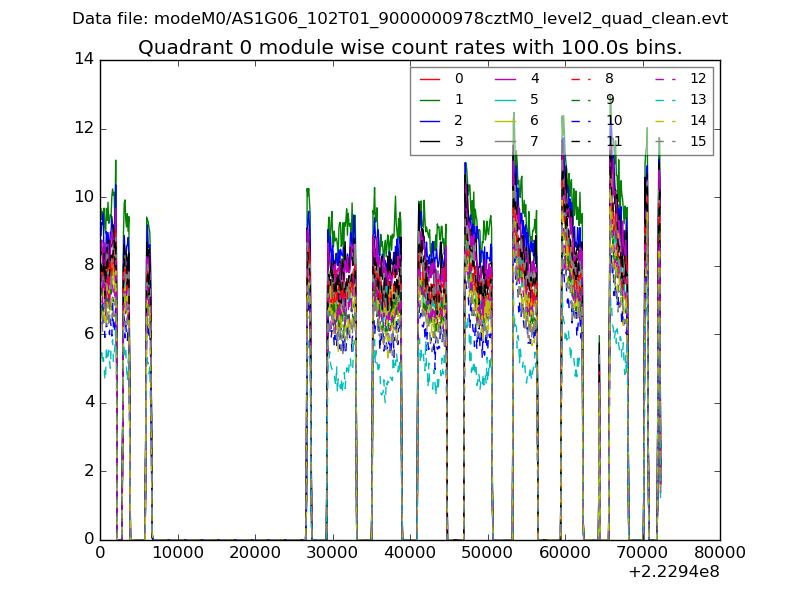 |
 |
| Module-wise count rates for Quadrant B Data is divided into 100 sec bins |
 |
 |
| Module-wise count rates for Quadrant C Data is divided into 100 sec bins |
 |
 |
| Module-wise count rates for Quadrant D Data is divided into 100 sec bins |
 |
 |
| Parameter | Plot |
|---|---|
| CZT HV Monitor |  |
| D_VDD |  |
| Temperature 1 | 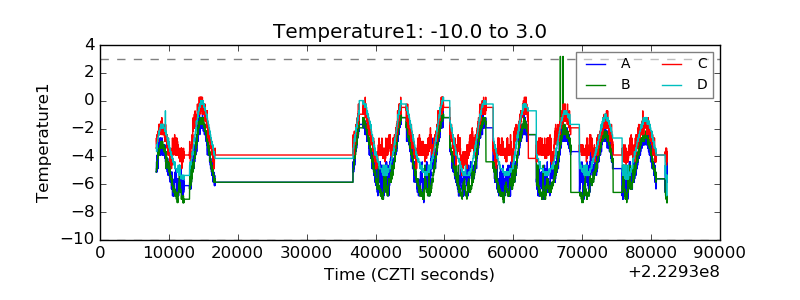 |
| Veto HV Monitor |  |
| Veto LLD |  |
| Alpha Counter |  |
| _CPM_Rate |  |
| CZT Counter |  |
| +2.5 Volts monitor | 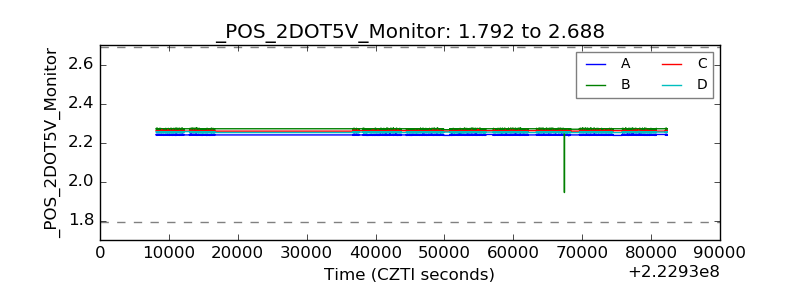 |
| +5 Volts monitor |  |
| _ROLL_ROT |  |
| _Roll_DEC |  |
| _Roll_RA | 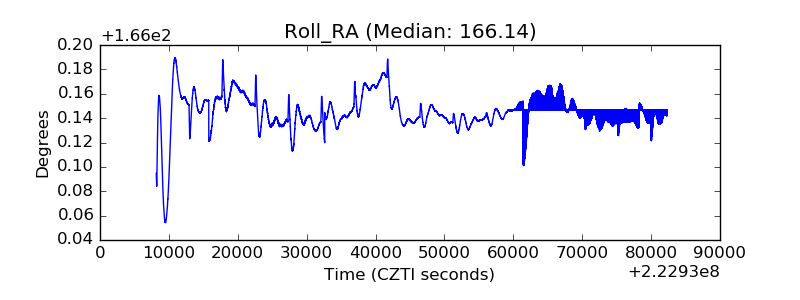 |
| Veto Counter |  |