| Param | Original file | Final file |
|---|---|---|
| Filename | modeM0/AS1A02_175T01_9000000976cztM0_level2.evt | modeM0/AS1A02_175T01_9000000976cztM0_level2_quad_clean.evt |
| Size (bytes) | 1,979,170,560 | 293,224,320 |
| Size | 1.8 GB | 279.6 MB |
| Events in quadrant A | 13,270,137 | 1,795,644 |
| Events in quadrant B | 12,510,879 | 1,865,013 |
| Events in quadrant C | 13,859,794 | 1,817,018 |
| Events in quadrant D | 18,613,115 | 1,683,507 |
| Mode SS | |||
|---|---|---|---|
| Quadrant | BADHDUFLAG | Total packets | Discarded packets |
| A | 0 | 512 | 0 |
| B | 0 | 512 | 0 |
| C | 0 | 512 | 0 |
| D | 0 | 512 | 0 |
| Mode M9 | |||
|---|---|---|---|
| Quadrant | BADHDUFLAG | Total packets | Discarded packets |
| A | 0 | 63 | 0 |
| B | 0 | 63 | 0 |
| C | 0 | 63 | 0 |
| D | 0 | 64 | 0 |
| Mode M0 | |||
|---|---|---|---|
| Quadrant | BADHDUFLAG | Total packets | Discarded packets |
| A | 0 | 55436 | 0 |
| B | 0 | 52973 | 0 |
| C | 0 | 57501 | 0 |
| D | 0 | 71473 | 0 |
| Quadrant | Total seconds | Saturated seconds | Saturation percentage |
|---|---|---|---|
| A | 24990 | 301 | 1.204482% |
| B | 24990 | 185 | 0.740296% |
| C | 24990 | 492 | 1.968788% |
| D | 24990 | 1407 | 5.630252% |
Noise dominated data is calculated using 1-second bins in cleaned event files. If a bin has >2000 counts, and if more than 50% of those come from <1% of pixels, then it is considered to be noise-dominated and hence unusable.
| Quadrant | # 1 sec bins | Bins with >0 counts | Bins with >2000 counts | High rate bins dominated by noise | Noise dominated (total time) | Noise dominated (detector-on time) | Marked lightcurve |
|---|---|---|---|---|---|---|---|
| A | 30109 | 24991 | 142 | 142 | 0.47% | 0.57% | 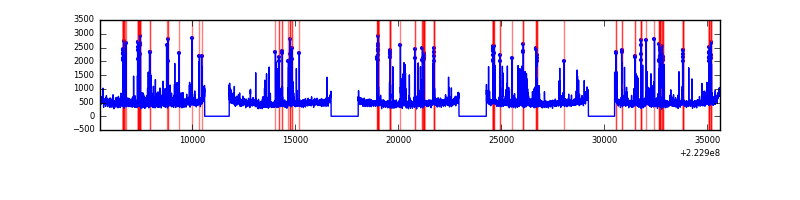 |
| B | 30109 | 24990 | 12 | 12 | 0.04% | 0.05% | 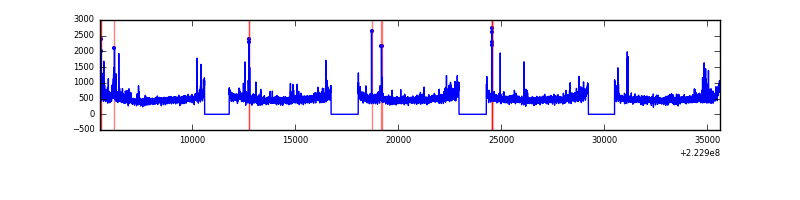 |
| C | 30109 | 24992 | 321 | 321 | 1.07% | 1.28% |  |
| D | 30109 | 24991 | 1134 | 1134 | 3.77% | 4.54% |  |
Top three noisy pixels from each quadrant. If the there are fewer than three noisy pixels in the level2.evt file, extra rows are filled as -1
| Pixel properties | Quadrant properties | ||||||
|---|---|---|---|---|---|---|---|
| Quadrant | DetID | PixID | Counts | Sigma | Mean | Median | Sigma |
| A | 14 | 238 | 1145878 | 1888.15 | 3007 | 2948 | 605.3 |
| A | 8 | 15 | 440049 | 722.1 | 3007 | 2948 | 605.3 |
| A | 3 | 1 | 50203 | 78.07 | 3007 | 2948 | 605.3 |
| B | 0 | 214 | 194589 | 332.77 | 3064 | 2993 | 575.8 |
| B | 0 | 219 | 187741 | 320.87 | 3064 | 2993 | 575.8 |
| B | 4 | 81 | 131022 | 222.36 | 3064 | 2993 | 575.8 |
| C | 4 | 254 | 1707980 | 2507.39 | 2938 | 2956 | 680.0 |
| C | 9 | 68 | 538742 | 787.92 | 2938 | 2956 | 680.0 |
| C | 7 | 247 | 106230 | 151.87 | 2938 | 2956 | 680.0 |
| D | 2 | 216 | 3291870 | 4702.47 | 2871 | 2784 | 699.4 |
| D | 14 | 34 | 1517387 | 2165.46 | 2871 | 2784 | 699.4 |
| D | 2 | 14 | 1369711 | 1954.32 | 2871 | 2784 | 699.4 |
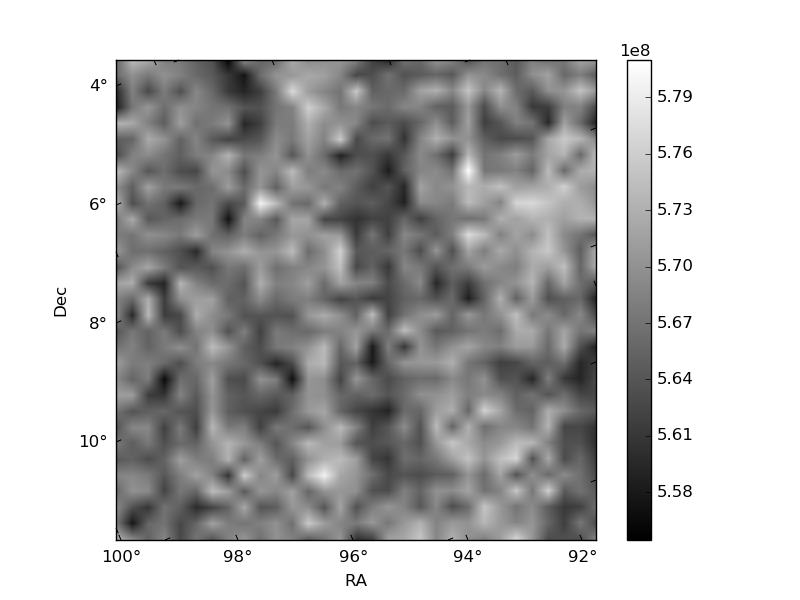
Histogram calculated using DETX and DETY for each event in the final _common_clean file
| Quadrant A |  |
 |
Quadrant B |
|---|---|---|---|
| Quadrant D |  |
 |
Quadrant C |
| Plot type | Count rate plots | Images |
|---|---|---|
| Comparison with Poisson distribution Blue bars denote a histogram of data divided into 1 sec bins. Red curve is a Poisson curve with rate = median count rate of data. |
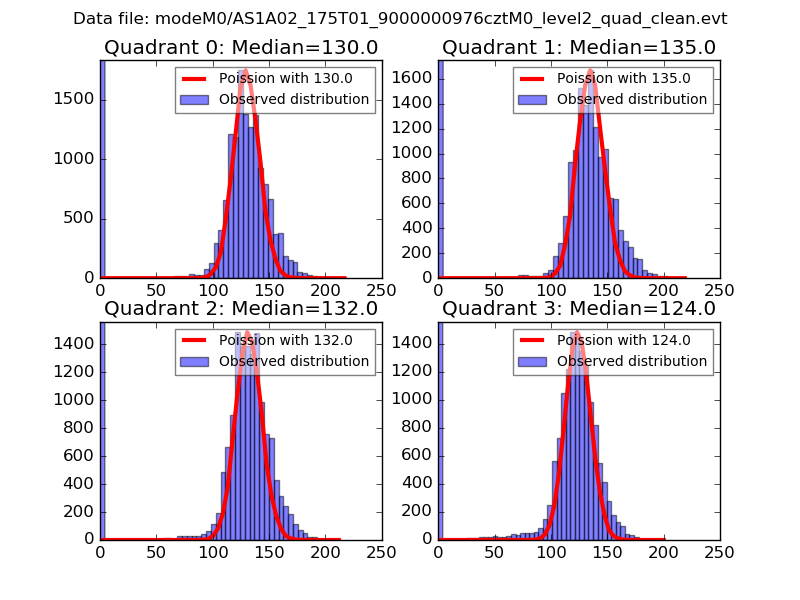 |
 |
| Quadrant-wise count rates Data is divided into 100 sec bins |
 |
|
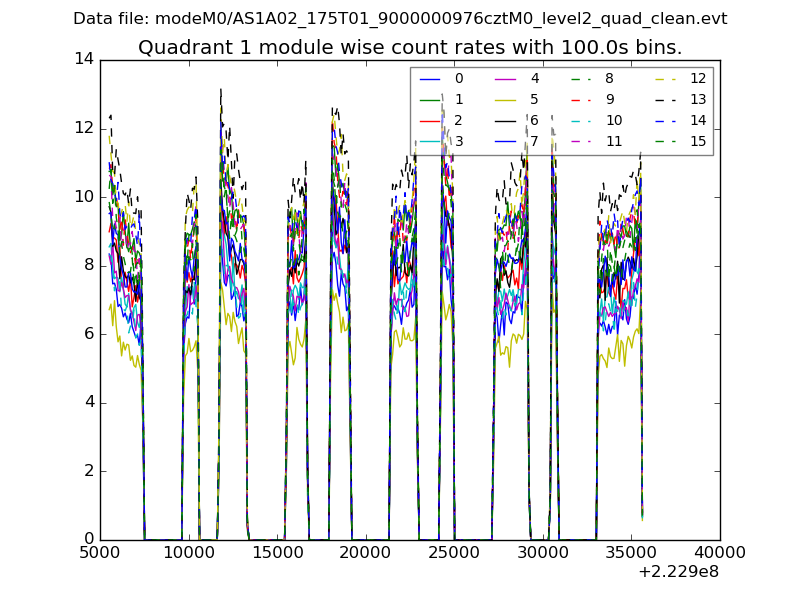
| Module-wise count rates for Quadrant A Data is divided into 100 sec bins |
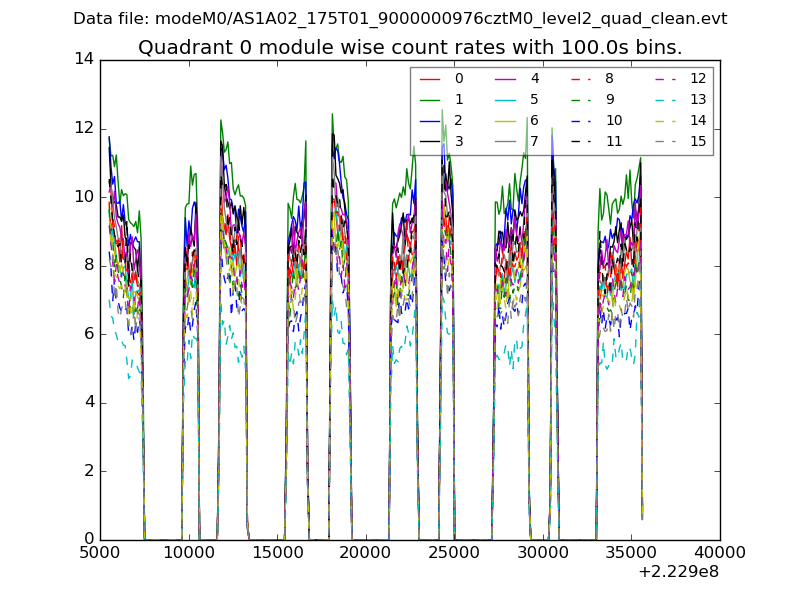 |
 |
| Module-wise count rates for Quadrant B Data is divided into 100 sec bins |
 |
 |
| Module-wise count rates for Quadrant C Data is divided into 100 sec bins |
 |
 |
| Module-wise count rates for Quadrant D Data is divided into 100 sec bins |
 |
 |
| Parameter | Plot |
|---|---|
| CZT HV Monitor |  |
| D_VDD |  |
| Temperature 1 |  |
| Veto HV Monitor |  |
| Veto LLD |  |
| Alpha Counter |  |
| _CPM_Rate |  |
| CZT Counter |  |
| +2.5 Volts monitor |  |
| +5 Volts monitor | 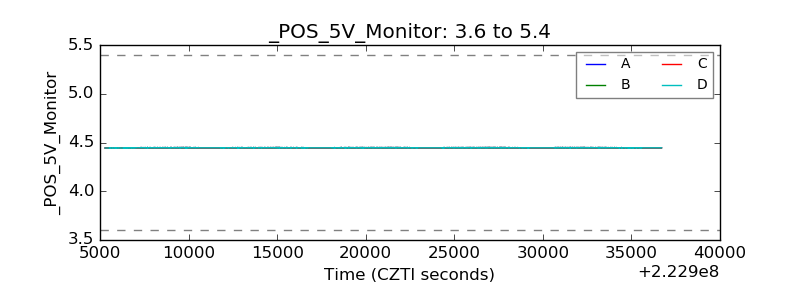 |
| _ROLL_ROT |  |
| _Roll_DEC |  |
| _Roll_RA |  |
| Veto Counter | 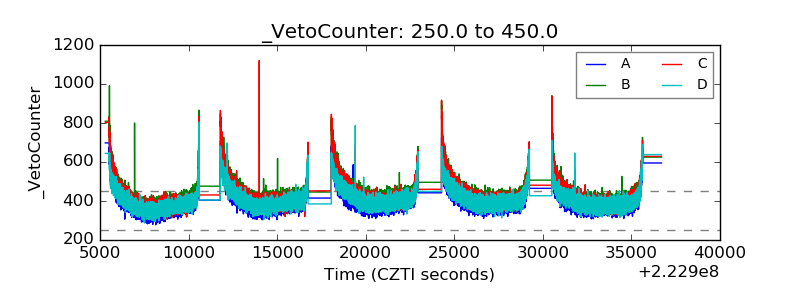 |