| Param | Original file | Final file |
|---|---|---|
| Filename | modeM0/AS1G06_164T01_9000000968cztM0_level2.evt | modeM0/AS1G06_164T01_9000000968cztM0_level2_quad_clean.evt |
| Size (bytes) | 2,093,201,280 | 482,702,400 |
| Size | 1.9 GB | 460.3 MB |
| Events in quadrant A | 15,339,885 | 3,100,762 |
| Events in quadrant B | 15,095,027 | 3,238,536 |
| Events in quadrant C | 13,787,888 | 3,130,711 |
| Events in quadrant D | 17,040,964 | 2,987,263 |
| Mode M0 | |||
|---|---|---|---|
| Quadrant | BADHDUFLAG | Total packets | Discarded packets |
| A | 0 | 67732 | 0 |
| B | 0 | 66763 | 0 |
| C | 0 | 64006 | 0 |
| D | 0 | 72228 | 0 |
| Mode SS | |||
|---|---|---|---|
| Quadrant | BADHDUFLAG | Total packets | Discarded packets |
| A | 0 | 646 | 0 |
| B | 0 | 646 | 0 |
| C | 0 | 646 | 0 |
| D | 0 | 646 | 0 |
| Mode M9 | |||
|---|---|---|---|
| Quadrant | BADHDUFLAG | Total packets | Discarded packets |
| A | 0 | 69 | 0 |
| B | 0 | 69 | 0 |
| C | 0 | 69 | 0 |
| D | 0 | 69 | 0 |
| Quadrant | Total seconds | Saturated seconds | Saturation percentage |
|---|---|---|---|
| A | 31475 | 2022 | 6.424146% |
| B | 31475 | 241 | 0.765687% |
| C | 31475 | 101 | 0.320890% |
| D | 31475 | 679 | 2.157268% |
Noise dominated data is calculated using 1-second bins in cleaned event files. If a bin has >2000 counts, and if more than 50% of those come from <1% of pixels, then it is considered to be noise-dominated and hence unusable.
| Quadrant | # 1 sec bins | Bins with >0 counts | Bins with >2000 counts | High rate bins dominated by noise | Noise dominated (total time) | Noise dominated (detector-on time) | Marked lightcurve |
|---|---|---|---|---|---|---|---|
| A | 42314 | 31483 | 242 | 242 | 0.57% | 0.77% |  |
| B | 42314 | 31483 | 18 | 18 | 0.04% | 0.06% |  |
| C | 42314 | 31483 | 2 | 2 | 0.00% | 0.01% |  |
| D | 42314 | 31483 | 451 | 451 | 1.07% | 1.43% |  |
Top three noisy pixels from each quadrant. If the there are fewer than three noisy pixels in the level2.evt file, extra rows are filled as -1
| Pixel properties | Quadrant properties | ||||||
|---|---|---|---|---|---|---|---|
| Quadrant | DetID | PixID | Counts | Sigma | Mean | Median | Sigma |
| A | 14 | 111 | 1604874 | 2258.4 | 3543 | 3464 | 709.1 |
| A | 8 | 15 | 52978 | 69.83 | 3543 | 3464 | 709.1 |
| A | 13 | 14 | 46529 | 60.73 | 3543 | 3464 | 709.1 |
| B | 0 | 219 | 362460 | 525.9 | 3664 | 3575 | 682.4 |
| B | 0 | 214 | 343486 | 498.09 | 3664 | 3575 | 682.4 |
| B | 0 | 228 | 96110 | 135.6 | 3664 | 3575 | 682.4 |
| C | 4 | 254 | 43211 | 49.38 | 3507 | 3512 | 803.9 |
| C | 7 | 247 | 39075 | 44.24 | 3507 | 3512 | 803.9 |
| C | 13 | 61 | 27765 | 30.17 | 3507 | 3512 | 803.9 |
| D | 12 | 233 | 1506744 | 1777.29 | 3480 | 3367 | 845.9 |
| D | 8 | 195 | 1199864 | 1414.5 | 3480 | 3367 | 845.9 |
| D | 1 | 83 | 392287 | 459.78 | 3480 | 3367 | 845.9 |
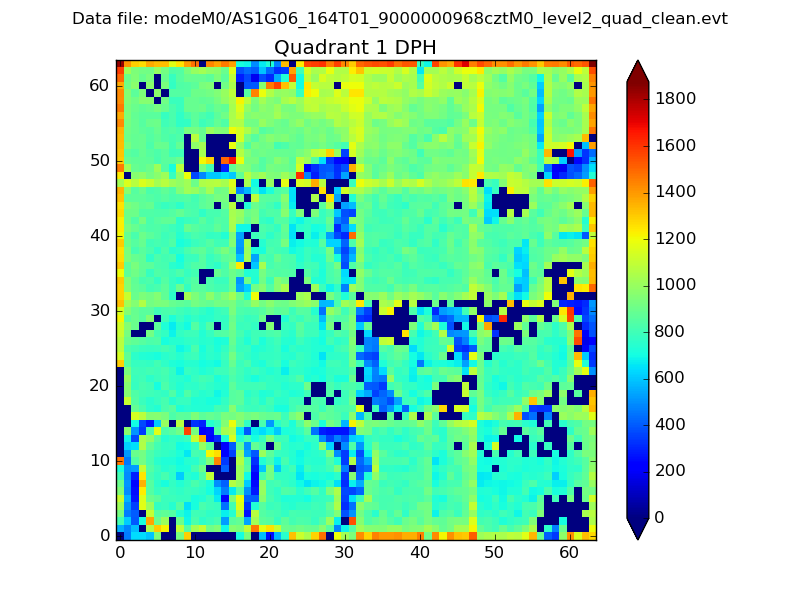
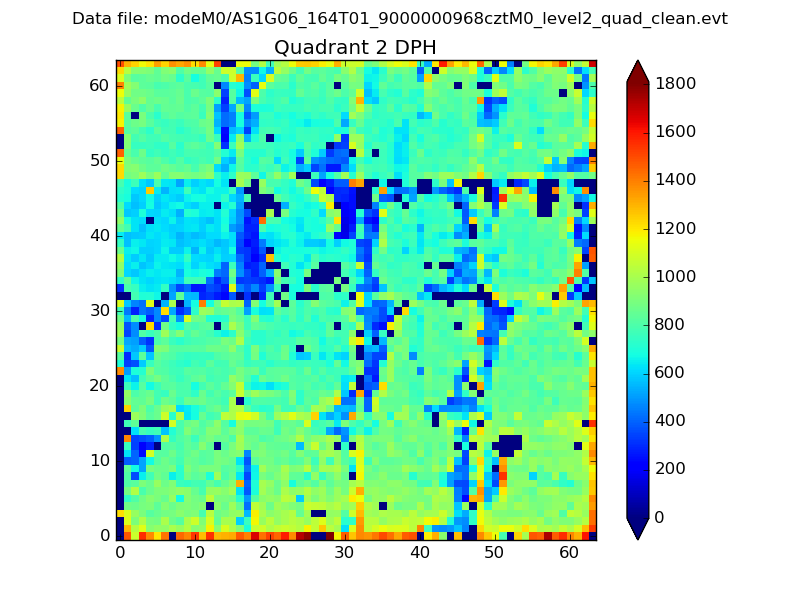
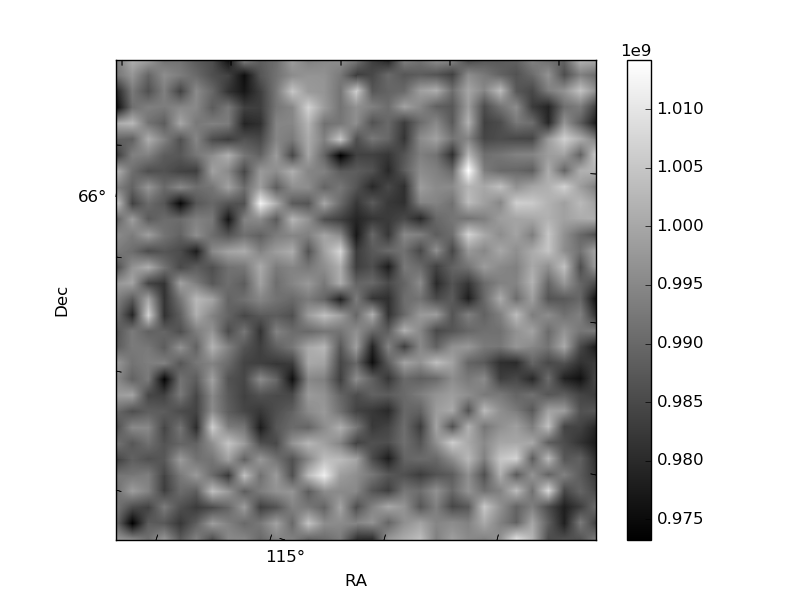
Histogram calculated using DETX and DETY for each event in the final _common_clean file
| Quadrant A |  |
 |
Quadrant B |
|---|---|---|---|
| Quadrant D |  |
 |
Quadrant C |
| Plot type | Count rate plots | Images |
|---|---|---|
| Comparison with Poisson distribution Blue bars denote a histogram of data divided into 1 sec bins. Red curve is a Poisson curve with rate = median count rate of data. |
 |
 |
| Quadrant-wise count rates Data is divided into 100 sec bins |
 |
|
| Module-wise count rates for Quadrant A Data is divided into 100 sec bins |
 |
 |
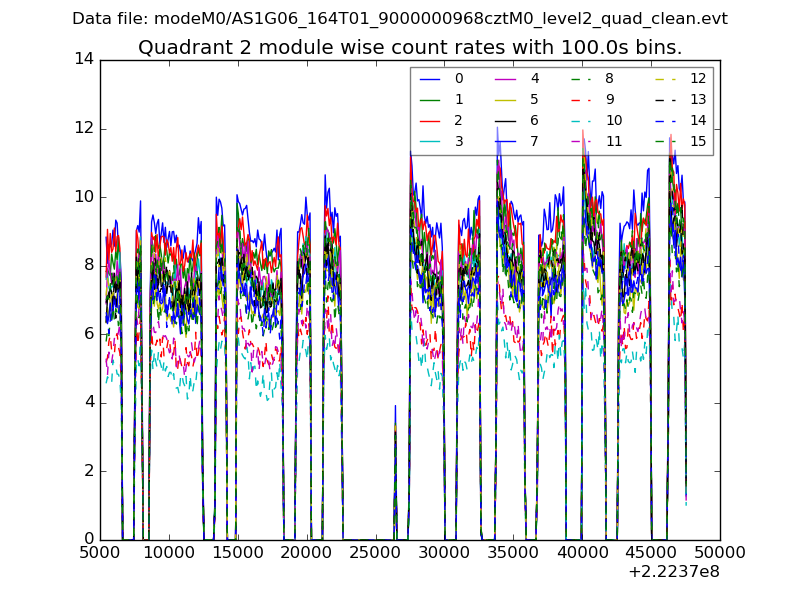
| Module-wise count rates for Quadrant B Data is divided into 100 sec bins |
 |
 |
| Module-wise count rates for Quadrant C Data is divided into 100 sec bins |
 |
 |
| Module-wise count rates for Quadrant D Data is divided into 100 sec bins |
 |
 |
| Parameter | Plot |
|---|---|
| CZT HV Monitor |  |
| D_VDD |  |
| Temperature 1 |  |
| Veto HV Monitor |  |
| Veto LLD |  |
| Alpha Counter |  |
| _CPM_Rate |  |
| CZT Counter |  |
| +2.5 Volts monitor |  |
| +5 Volts monitor | 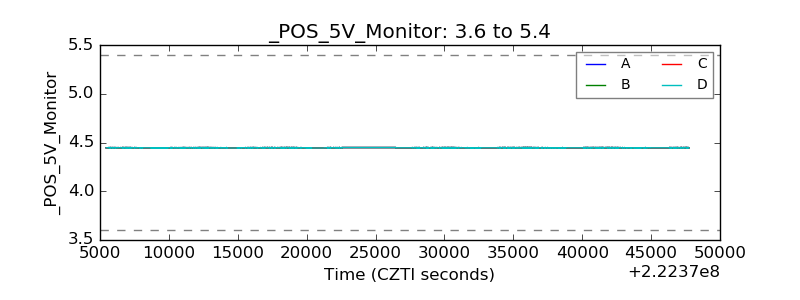 |
| _ROLL_ROT | 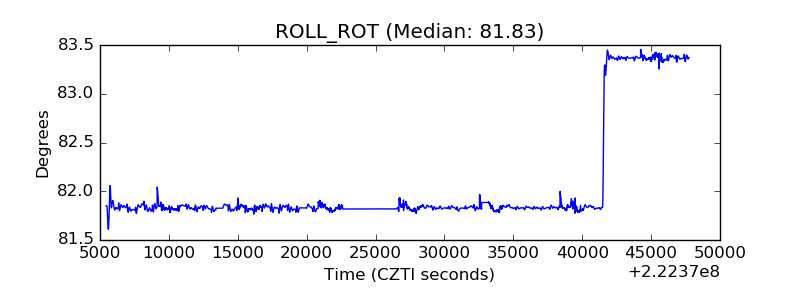 |
| _Roll_DEC |  |
| _Roll_RA |  |
| Veto Counter |  |