| Param | Original file | Final file |
|---|---|---|
| Filename | modeM0/AS1A02_155T01_9000000966cztM0_level2.evt | modeM0/AS1A02_155T01_9000000966cztM0_level2_quad_clean.evt |
| Size (bytes) | 6,036,675,840 | 1,080,187,200 |
| Size | 5.6 GB | 1.0 GB |
| Events in quadrant A | 41,164,266 | 6,719,236 |
| Events in quadrant B | 45,002,979 | 6,825,490 |
| Events in quadrant C | 43,843,118 | 6,705,989 |
| Events in quadrant D | 46,884,914 | 6,446,354 |
| Mode SS | |||
|---|---|---|---|
| Quadrant | BADHDUFLAG | Total packets | Discarded packets |
| A | 0 | 1792 | 0 |
| B | 0 | 1792 | 0 |
| C | 0 | 1792 | 0 |
| D | 0 | 1792 | 0 |
| Mode M9 | |||
|---|---|---|---|
| Quadrant | BADHDUFLAG | Total packets | Discarded packets |
| A | 0 | 110 | 0 |
| B | 0 | 110 | 0 |
| C | 0 | 110 | 0 |
| D | 0 | 110 | 0 |
| Mode M0 | |||
|---|---|---|---|
| Quadrant | BADHDUFLAG | Total packets | Discarded packets |
| A | 0 | 182508 | 0 |
| B | 0 | 191933 | 0 |
| C | 0 | 191028 | 0 |
| D | 0 | 195851 | 0 |
| Quadrant | Total seconds | Saturated seconds | Saturation percentage |
|---|---|---|---|
| A | 87813 | 1243 | 1.415508% |
| B | 87813 | 1682 | 1.915434% |
| C | 87813 | 1435 | 1.634154% |
| D | 87813 | 1416 | 1.612518% |
Noise dominated data is calculated using 1-second bins in cleaned event files. If a bin has >2000 counts, and if more than 50% of those come from <1% of pixels, then it is considered to be noise-dominated and hence unusable.
| Quadrant | # 1 sec bins | Bins with >0 counts | Bins with >2000 counts | High rate bins dominated by noise | Noise dominated (total time) | Noise dominated (detector-on time) | Marked lightcurve |
|---|---|---|---|---|---|---|---|
| A | 102036 | 87830 | 174 | 174 | 0.17% | 0.20% | 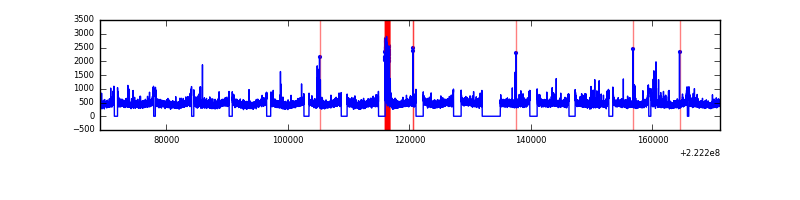 |
| B | 102036 | 87830 | 523 | 523 | 0.51% | 0.60% | 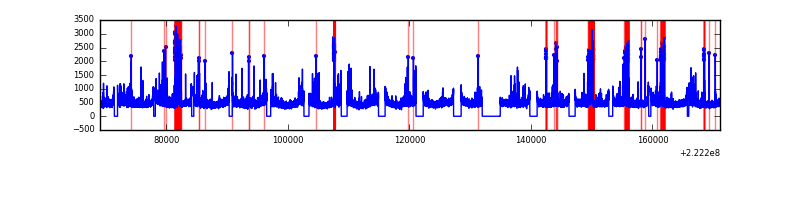 |
| C | 102036 | 87830 | 546 | 546 | 0.54% | 0.62% |  |
| D | 102036 | 87830 | 612 | 612 | 0.60% | 0.70% |  |
Top three noisy pixels from each quadrant. If the there are fewer than three noisy pixels in the level2.evt file, extra rows are filled as -1
| Pixel properties | Quadrant properties | ||||||
|---|---|---|---|---|---|---|---|
| Quadrant | DetID | PixID | Counts | Sigma | Mean | Median | Sigma |
| A | 15 | 234 | 798435 | 378.26 | 10336 | 10113 | 2084.0 |
| A | 8 | 15 | 248577 | 114.42 | 10336 | 10113 | 2084.0 |
| A | 13 | 14 | 112489 | 49.12 | 10336 | 10113 | 2084.0 |
| B | 4 | 239 | 1835230 | 931.49 | 10417 | 10179 | 1959.3 |
| B | 0 | 214 | 1197238 | 605.87 | 10417 | 10179 | 1959.3 |
| B | 4 | 81 | 998421 | 504.39 | 10417 | 10179 | 1959.3 |
| C | 9 | 68 | 2434247 | 1036.66 | 10116 | 10171 | 2338.4 |
| C | 4 | 254 | 1837469 | 781.44 | 10116 | 10171 | 2338.4 |
| C | 13 | 61 | 79356 | 29.59 | 10116 | 10171 | 2338.4 |
| D | 8 | 195 | 4556953 | 1854.83 | 10093 | 9799 | 2451.5 |
| D | 12 | 233 | 1558819 | 631.86 | 10093 | 9799 | 2451.5 |
| D | 14 | 34 | 998436 | 403.28 | 10093 | 9799 | 2451.5 |
Histogram calculated using DETX and DETY for each event in the final _common_clean file
| Quadrant A |  |
 |
Quadrant B |
|---|---|---|---|
| Quadrant D | 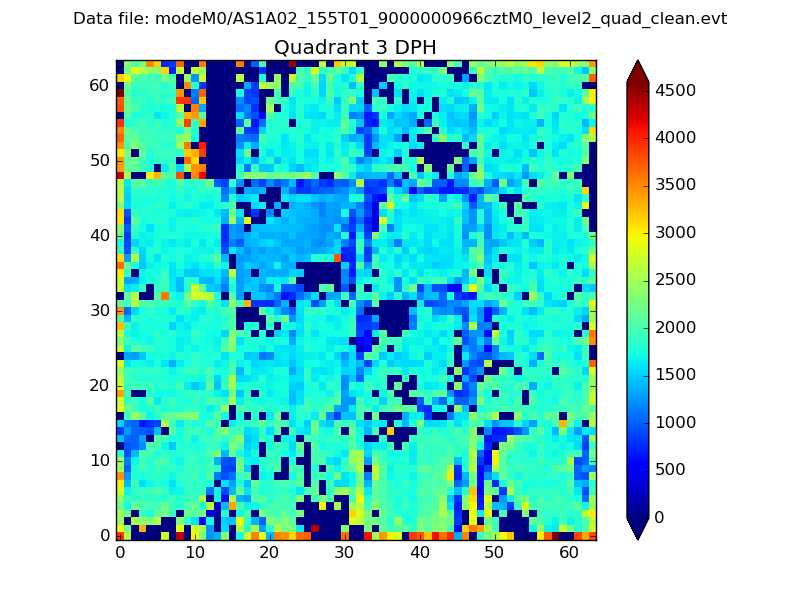 |
 |
Quadrant C |
| Plot type | Count rate plots | Images |
|---|---|---|
| Comparison with Poisson distribution Blue bars denote a histogram of data divided into 1 sec bins. Red curve is a Poisson curve with rate = median count rate of data. |
 |
 |
| Quadrant-wise count rates Data is divided into 100 sec bins |
 |
|
| Module-wise count rates for Quadrant A Data is divided into 100 sec bins |
 |
 |
| Module-wise count rates for Quadrant B Data is divided into 100 sec bins |
 |
 |
| Module-wise count rates for Quadrant C Data is divided into 100 sec bins |
 |
 |
| Module-wise count rates for Quadrant D Data is divided into 100 sec bins |
 |
 |
| Parameter | Plot |
|---|---|
| CZT HV Monitor |  |
| D_VDD |  |
| Temperature 1 |  |
| Veto HV Monitor | 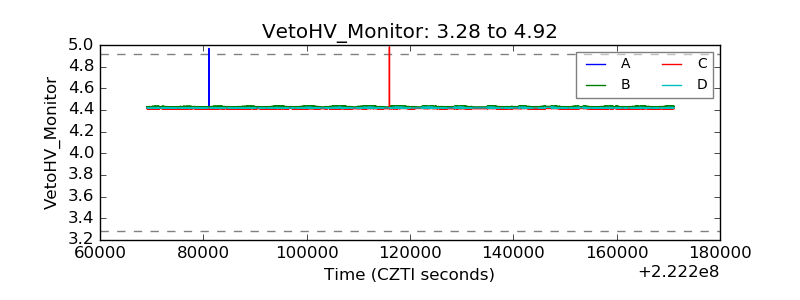 |
| Veto LLD | 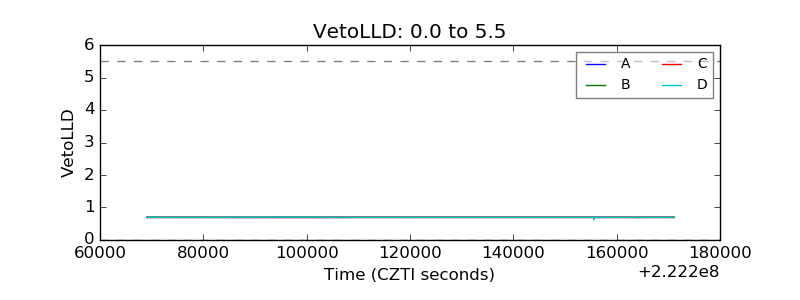 |
| Alpha Counter |  |
| _CPM_Rate |  |
| CZT Counter |  |
| +2.5 Volts monitor |  |
| +5 Volts monitor | 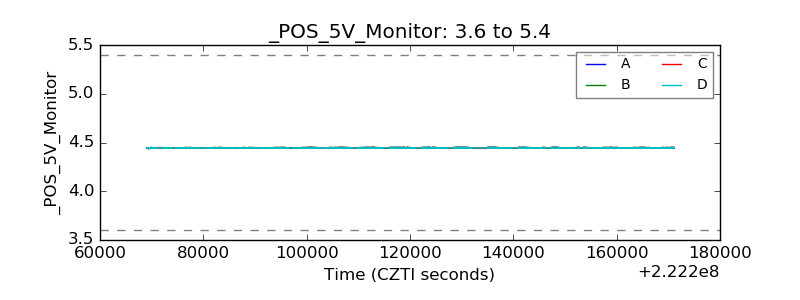 |
| _ROLL_ROT |  |
| _Roll_DEC |  |
| _Roll_RA | 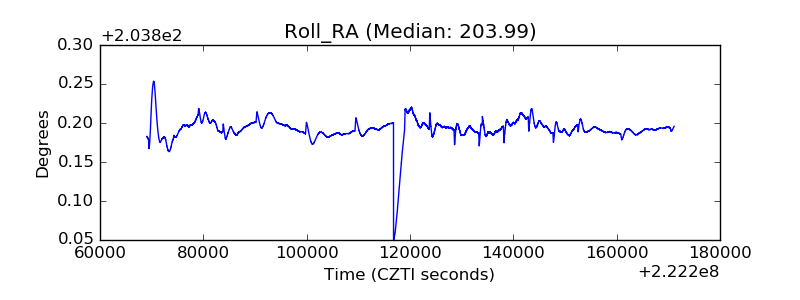 |
| Veto Counter |  |