| Param | Original file | Final file |
|---|---|---|
| Filename | modeM0/AS1G06_029T01_9000000964cztM0_level2.evt | modeM0/AS1G06_029T01_9000000964cztM0_level2_quad_clean.evt |
| Size (bytes) | 9,380,911,680 | 1,749,890,880 |
| Size | 8.7 GB | 1.6 GB |
| Events in quadrant A | 63,748,235 | 11,182,165 |
| Events in quadrant B | 68,427,558 | 11,284,260 |
| Events in quadrant C | 63,586,275 | 11,098,402 |
| Events in quadrant D | 79,445,186 | 10,400,506 |
| Mode M0 | |||
|---|---|---|---|
| Quadrant | BADHDUFLAG | Total packets | Discarded packets |
| A | 0 | 274357 | 0 |
| B | 0 | 286655 | 0 |
| C | 0 | 276049 | 0 |
| D | 0 | 320060 | 0 |
| Mode SS | |||
|---|---|---|---|
| Quadrant | BADHDUFLAG | Total packets | Discarded packets |
| A | 0 | 2686 | 0 |
| B | 0 | 2686 | 0 |
| C | 0 | 2686 | 0 |
| D | 0 | 2686 | 0 |
| Mode M9 | |||
|---|---|---|---|
| Quadrant | BADHDUFLAG | Total packets | Discarded packets |
| A | 0 | 222 | 0 |
| B | 0 | 222 | 0 |
| C | 0 | 222 | 0 |
| D | 0 | 222 | 0 |
| Quadrant | Total seconds | Saturated seconds | Saturation percentage |
|---|---|---|---|
| A | 131935 | 1795 | 1.360518% |
| B | 131935 | 2335 | 1.769811% |
| C | 131935 | 1612 | 1.221814% |
| D | 131935 | 3974 | 3.012089% |
Noise dominated data is calculated using 1-second bins in cleaned event files. If a bin has >2000 counts, and if more than 50% of those come from <1% of pixels, then it is considered to be noise-dominated and hence unusable.
| Quadrant | # 1 sec bins | Bins with >0 counts | Bins with >2000 counts | High rate bins dominated by noise | Noise dominated (total time) | Noise dominated (detector-on time) | Marked lightcurve |
|---|---|---|---|---|---|---|---|
| A | 154020 | 131962 | 29 | 29 | 0.02% | 0.02% |  |
| B | 154020 | 131962 | 366 | 366 | 0.24% | 0.28% | 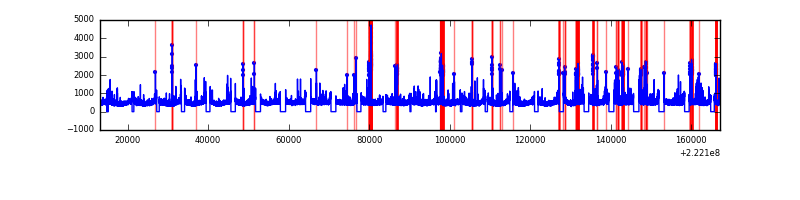 |
| C | 154020 | 131962 | 537 | 537 | 0.35% | 0.41% |  |
| D | 154020 | 131961 | 2348 | 2348 | 1.52% | 1.78% |  |
Top three noisy pixels from each quadrant. If the there are fewer than three noisy pixels in the level2.evt file, extra rows are filled as -1
| Pixel properties | Quadrant properties | ||||||
|---|---|---|---|---|---|---|---|
| Quadrant | DetID | PixID | Counts | Sigma | Mean | Median | Sigma |
| A | 15 | 234 | 412570 | 120.22 | 16278 | 15964 | 3299.0 |
| A | 13 | 251 | 242596 | 68.7 | 16278 | 15964 | 3299.0 |
| A | 8 | 15 | 229304 | 64.67 | 16278 | 15964 | 3299.0 |
| B | 0 | 214 | 1452021 | 466.98 | 16375 | 16033 | 3075.1 |
| B | 3 | 220 | 1055271 | 337.95 | 16375 | 16033 | 3075.1 |
| B | 7 | 202 | 605606 | 191.73 | 16375 | 16033 | 3075.1 |
| C | 9 | 68 | 1741848 | 475.66 | 15753 | 15917 | 3628.5 |
| C | 1 | 16 | 185723 | 46.8 | 15753 | 15917 | 3628.5 |
| C | 13 | 61 | 122417 | 29.35 | 15753 | 15917 | 3628.5 |
| D | 2 | 216 | 9107166 | 2357.86 | 15663 | 15210 | 3856.0 |
| D | 8 | 195 | 5238555 | 1354.6 | 15663 | 15210 | 3856.0 |
| D | 12 | 233 | 3299728 | 851.79 | 15663 | 15210 | 3856.0 |
Histogram calculated using DETX and DETY for each event in the final _common_clean file
| Quadrant A | 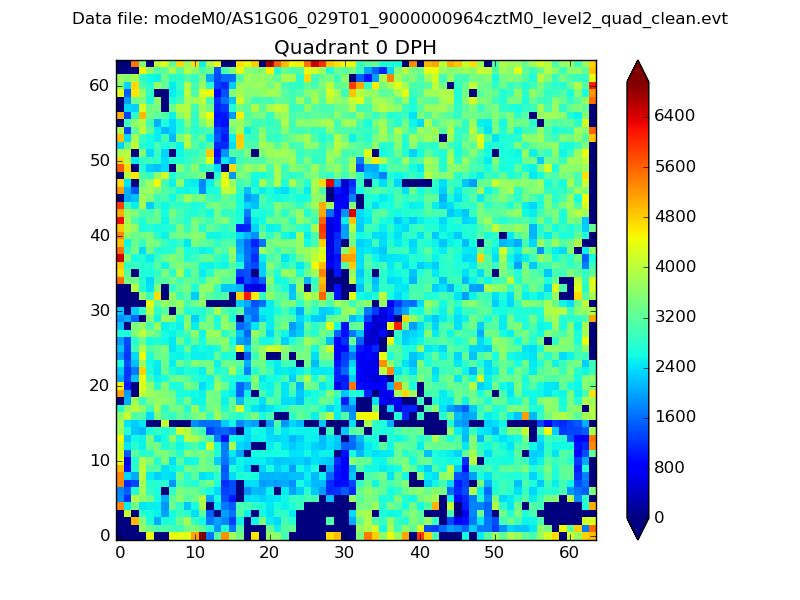 |
 |
Quadrant B |
|---|---|---|---|
| Quadrant D |  |
 |
Quadrant C |
| Plot type | Count rate plots | Images |
|---|---|---|
| Comparison with Poisson distribution Blue bars denote a histogram of data divided into 1 sec bins. Red curve is a Poisson curve with rate = median count rate of data. |
 |
 |
| Quadrant-wise count rates Data is divided into 100 sec bins |
 |
|
| Module-wise count rates for Quadrant A Data is divided into 100 sec bins |
 |
 |
| Module-wise count rates for Quadrant B Data is divided into 100 sec bins |
 |
 |
| Module-wise count rates for Quadrant C Data is divided into 100 sec bins |
 |
 |
| Module-wise count rates for Quadrant D Data is divided into 100 sec bins |
 |
 |
| Parameter | Plot |
|---|---|
| CZT HV Monitor | 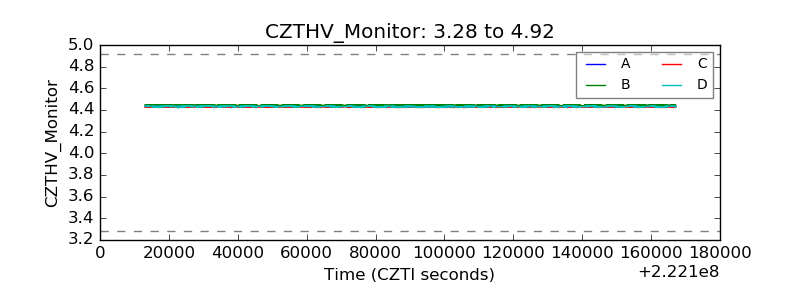 |
| D_VDD | 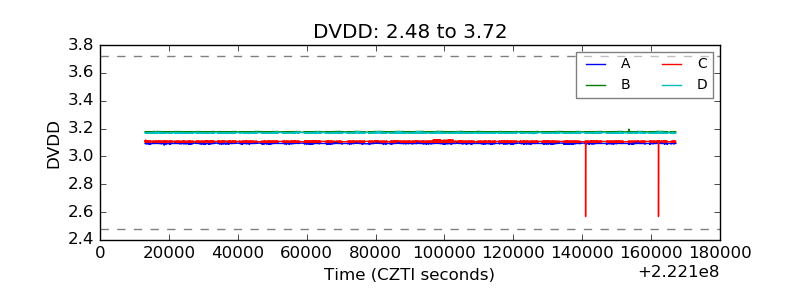 |
| Temperature 1 |  |
| Veto HV Monitor | 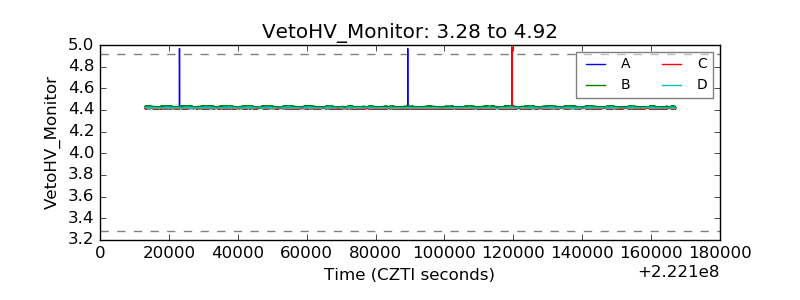 |
| Veto LLD |  |
| Alpha Counter |  |
| _CPM_Rate |  |
| CZT Counter |  |
| +2.5 Volts monitor |  |
| +5 Volts monitor |  |
| _ROLL_ROT |  |
| _Roll_DEC |  |
| _Roll_RA |  |
| Veto Counter |  |