| Param | Original file | Final file |
|---|---|---|
| Filename | modeM0/AS1G06_026T01_9000000962cztM0_level2.evt | modeM0/AS1G06_026T01_9000000962cztM0_level2_quad_clean.evt |
| Size (bytes) | 4,885,908,480 | 975,291,840 |
| Size | 4.6 GB | 930.1 MB |
| Events in quadrant A | 34,311,379 | 6,159,801 |
| Events in quadrant B | 36,362,294 | 6,230,367 |
| Events in quadrant C | 33,859,024 | 6,115,085 |
| Events in quadrant D | 38,345,799 | 5,866,686 |
| Mode M9 | |||
|---|---|---|---|
| Quadrant | BADHDUFLAG | Total packets | Discarded packets |
| A | 0 | 118 | 0 |
| B | 0 | 118 | 0 |
| C | 0 | 118 | 0 |
| D | 0 | 118 | 0 |
| Mode M0 | |||
|---|---|---|---|
| Quadrant | BADHDUFLAG | Total packets | Discarded packets |
| A | 0 | 154269 | 0 |
| B | 0 | 158640 | 0 |
| C | 0 | 153901 | 0 |
| D | 0 | 165335 | 0 |
| Mode SS | |||
|---|---|---|---|
| Quadrant | BADHDUFLAG | Total packets | Discarded packets |
| A | 0 | 1532 | 0 |
| B | 0 | 1532 | 0 |
| C | 0 | 1532 | 0 |
| D | 0 | 1532 | 0 |
| Quadrant | Total seconds | Saturated seconds | Saturation percentage |
|---|---|---|---|
| A | 75412 | 786 | 1.042274% |
| B | 75412 | 891 | 1.181510% |
| C | 75412 | 589 | 0.781043% |
| D | 75412 | 1326 | 1.758341% |
Noise dominated data is calculated using 1-second bins in cleaned event files. If a bin has >2000 counts, and if more than 50% of those come from <1% of pixels, then it is considered to be noise-dominated and hence unusable.
| Quadrant | # 1 sec bins | Bins with >0 counts | Bins with >2000 counts | High rate bins dominated by noise | Noise dominated (total time) | Noise dominated (detector-on time) | Marked lightcurve |
|---|---|---|---|---|---|---|---|
| A | 87012 | 75427 | 15 | 15 | 0.02% | 0.02% |  |
| B | 87012 | 75427 | 17 | 17 | 0.02% | 0.02% |  |
| C | 87012 | 75427 | 0 | 0 | 0.00% | 0.00% | 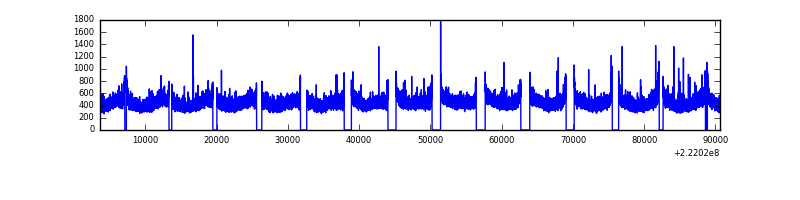 |
| D | 87012 | 75427 | 637 | 637 | 0.73% | 0.84% | 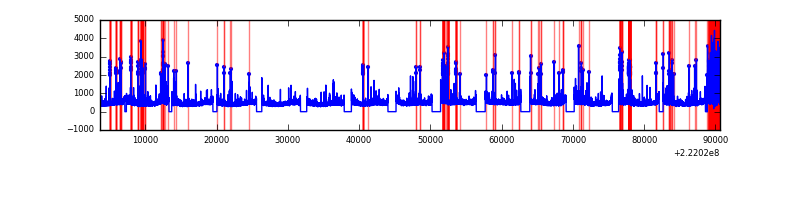 |
Top three noisy pixels from each quadrant. If the there are fewer than three noisy pixels in the level2.evt file, extra rows are filled as -1
| Pixel properties | Quadrant properties | ||||||
|---|---|---|---|---|---|---|---|
| Quadrant | DetID | PixID | Counts | Sigma | Mean | Median | Sigma |
| A | 4 | 2 | 105903 | 54.52 | 8842 | 8640 | 1783.9 |
| A | 13 | 14 | 95360 | 48.61 | 8842 | 8640 | 1783.9 |
| A | 0 | 226 | 84822 | 42.71 | 8842 | 8640 | 1783.9 |
| B | 0 | 214 | 890246 | 530.56 | 8900 | 8687 | 1661.6 |
| B | 4 | 173 | 182580 | 104.66 | 8900 | 8687 | 1661.6 |
| B | 4 | 81 | 175844 | 100.6 | 8900 | 8687 | 1661.6 |
| C | 13 | 61 | 67656 | 29.84 | 8638 | 8667 | 1976.5 |
| C | 12 | 4 | 64241 | 28.12 | 8638 | 8667 | 1976.5 |
| C | 1 | 16 | 41075 | 16.4 | 8638 | 8667 | 1976.5 |
| D | 8 | 195 | 1712533 | 817.02 | 8611 | 8348 | 2085.8 |
| D | 2 | 216 | 1391215 | 662.98 | 8611 | 8348 | 2085.8 |
| D | 12 | 233 | 584925 | 276.42 | 8611 | 8348 | 2085.8 |
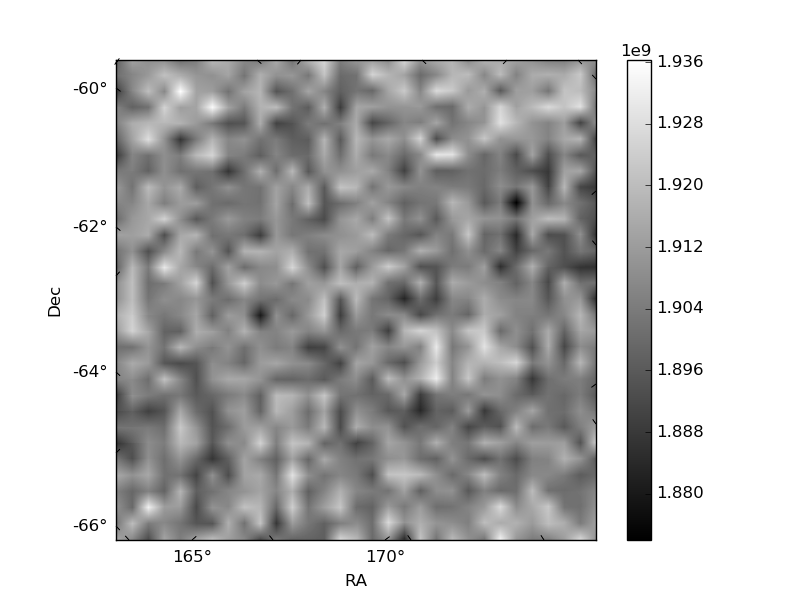
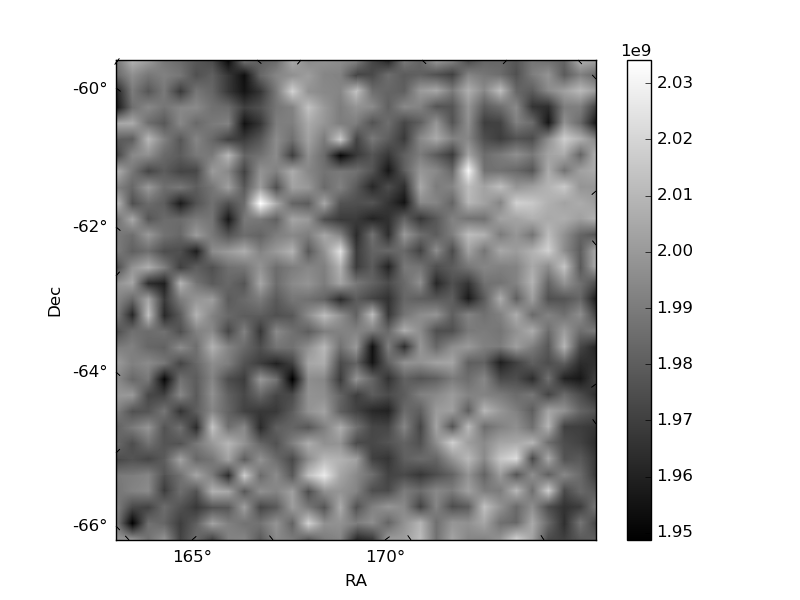
Histogram calculated using DETX and DETY for each event in the final _common_clean file
| Quadrant A | 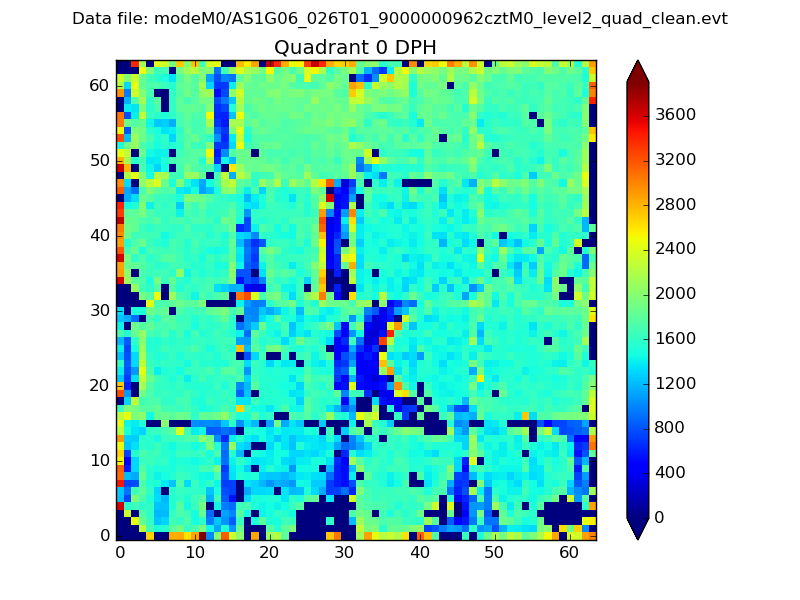 |
 |
Quadrant B |
|---|---|---|---|
| Quadrant D |  |
 |
Quadrant C |
| Plot type | Count rate plots | Images |
|---|---|---|
| Comparison with Poisson distribution Blue bars denote a histogram of data divided into 1 sec bins. Red curve is a Poisson curve with rate = median count rate of data. |
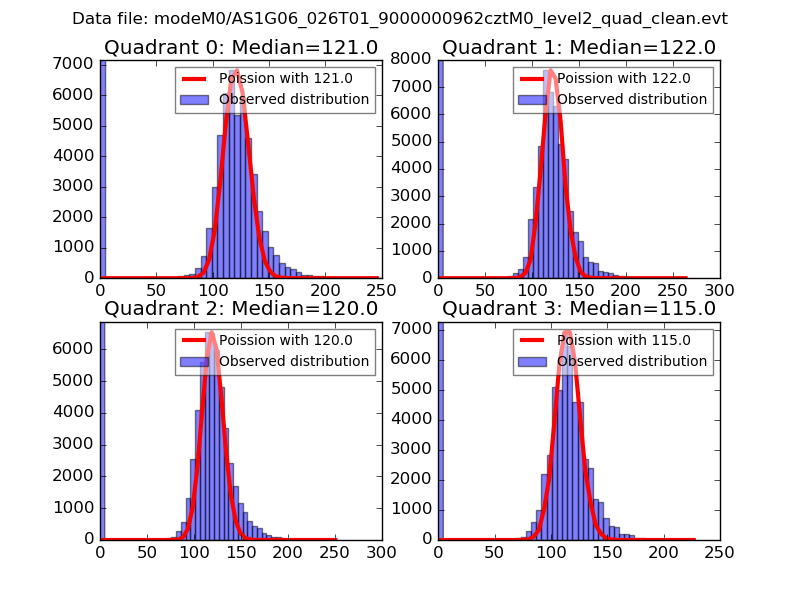 |
 |
| Quadrant-wise count rates Data is divided into 100 sec bins |
 |
|
| Module-wise count rates for Quadrant A Data is divided into 100 sec bins |
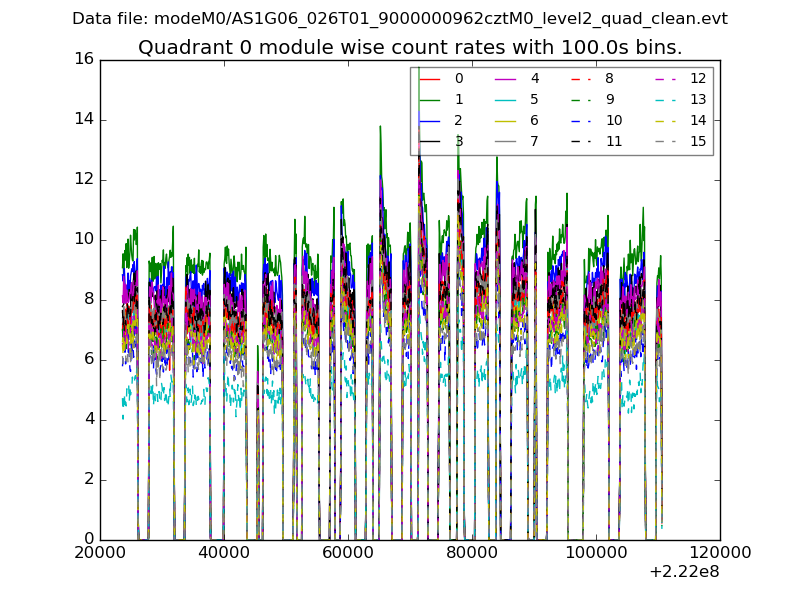 |
 |
| Module-wise count rates for Quadrant B Data is divided into 100 sec bins |
 |
 |
| Module-wise count rates for Quadrant C Data is divided into 100 sec bins |
 |
 |
| Module-wise count rates for Quadrant D Data is divided into 100 sec bins |
 |
 |
| Parameter | Plot |
|---|---|
| CZT HV Monitor |  |
| D_VDD |  |
| Temperature 1 | 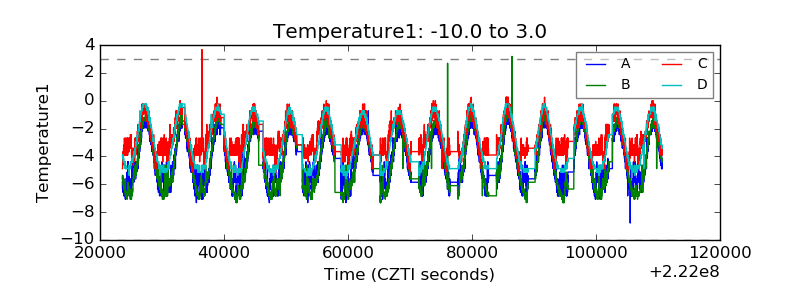 |
| Veto HV Monitor | 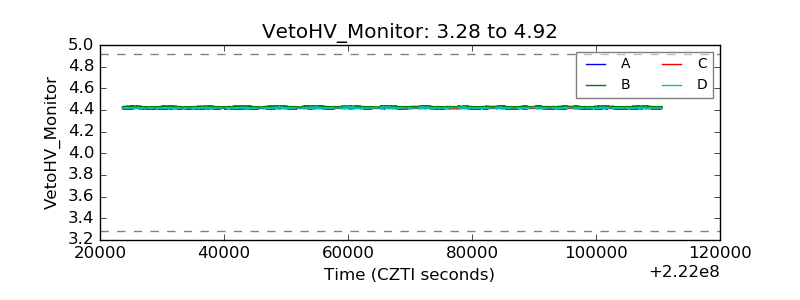 |
| Veto LLD |  |
| Alpha Counter |  |
| _CPM_Rate | 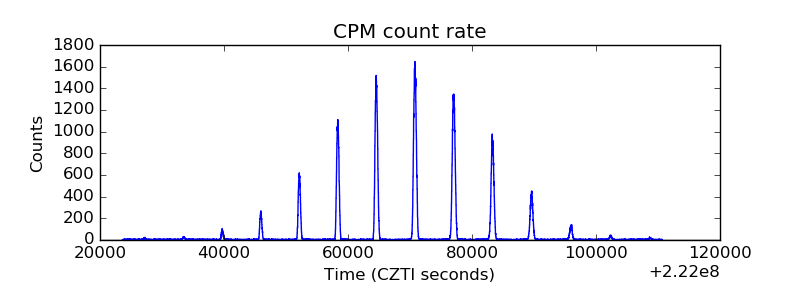 |
| CZT Counter |  |
| +2.5 Volts monitor |  |
| +5 Volts monitor |  |
| _ROLL_ROT | 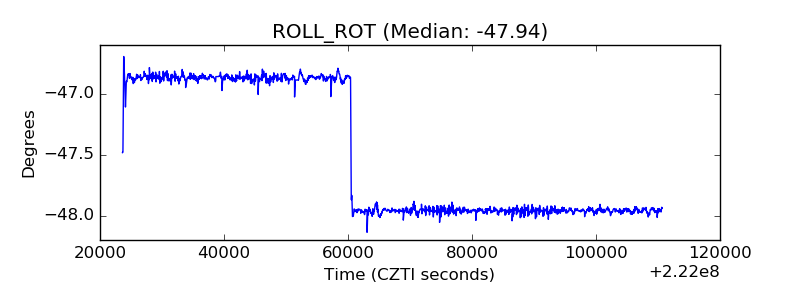 |
| _Roll_DEC |  |
| _Roll_RA |  |
| Veto Counter |  |