| Param | Original file | Final file |
|---|---|---|
| Filename | modeM0/AS1T01_151T01_9000000960cztM0_level2.evt | modeM0/AS1T01_151T01_9000000960cztM0_level2_quad_clean.evt |
| Size (bytes) | 8,274,824,640 | 1,624,268,160 |
| Size | 7.7 GB | 1.5 GB |
| Events in quadrant A | 58,759,788 | 10,343,081 |
| Events in quadrant B | 62,814,013 | 10,376,228 |
| Events in quadrant C | 56,521,590 | 10,154,212 |
| Events in quadrant D | 64,127,307 | 9,816,574 |
| Mode SS | |||
|---|---|---|---|
| Quadrant | BADHDUFLAG | Total packets | Discarded packets |
| A | 0 | 2532 | 0 |
| B | 0 | 2532 | 0 |
| C | 0 | 2532 | 0 |
| D | 0 | 2532 | 0 |
| Mode M0 | |||
|---|---|---|---|
| Quadrant | BADHDUFLAG | Total packets | Discarded packets |
| A | 0 | 258635 | 0 |
| B | 0 | 268188 | 0 |
| C | 0 | 254892 | 0 |
| D | 0 | 271638 | 0 |
| Mode M9 | |||
|---|---|---|---|
| Quadrant | BADHDUFLAG | Total packets | Discarded packets |
| A | 0 | 217 | 0 |
| B | 0 | 217 | 0 |
| C | 0 | 217 | 0 |
| D | 0 | 217 | 0 |
| Quadrant | Total seconds | Saturated seconds | Saturation percentage |
|---|---|---|---|
| A | 124191 | 1818 | 1.463874% |
| B | 124191 | 2159 | 1.738451% |
| C | 124191 | 947 | 0.762535% |
| D | 124191 | 2010 | 1.618475% |
Noise dominated data is calculated using 1-second bins in cleaned event files. If a bin has >2000 counts, and if more than 50% of those come from <1% of pixels, then it is considered to be noise-dominated and hence unusable.
| Quadrant | # 1 sec bins | Bins with >0 counts | Bins with >2000 counts | High rate bins dominated by noise | Noise dominated (total time) | Noise dominated (detector-on time) | Marked lightcurve |
|---|---|---|---|---|---|---|---|
| A | 145216 | 124216 | 251 | 251 | 0.17% | 0.20% |  |
| B | 145216 | 124216 | 485 | 485 | 0.33% | 0.39% |  |
| C | 145216 | 124216 | 8 | 8 | 0.01% | 0.01% |  |
| D | 145216 | 124216 | 936 | 936 | 0.64% | 0.75% |  |
Top three noisy pixels from each quadrant. If the there are fewer than three noisy pixels in the level2.evt file, extra rows are filled as -1
| Pixel properties | Quadrant properties | ||||||
|---|---|---|---|---|---|---|---|
| Quadrant | DetID | PixID | Counts | Sigma | Mean | Median | Sigma |
| A | 14 | 239 | 761086 | 250.14 | 14864 | 14543 | 2984.4 |
| A | 15 | 234 | 388617 | 125.34 | 14864 | 14543 | 2984.4 |
| A | 13 | 248 | 232761 | 73.12 | 14864 | 14543 | 2984.4 |
| B | 4 | 239 | 1489486 | 525.7 | 14920 | 14576 | 2805.6 |
| B | 0 | 214 | 1216164 | 428.28 | 14920 | 14576 | 2805.6 |
| B | 0 | 228 | 828399 | 290.07 | 14920 | 14576 | 2805.6 |
| C | 10 | 22 | 230382 | 65.1 | 14391 | 14443 | 3317.2 |
| C | 13 | 61 | 113106 | 29.74 | 14391 | 14443 | 3317.2 |
| C | 1 | 16 | 89259 | 22.55 | 14391 | 14443 | 3317.2 |
| D | 8 | 195 | 4111000 | 1173.33 | 14431 | 13988 | 3491.8 |
| D | 1 | 239 | 1355567 | 384.21 | 14431 | 13988 | 3491.8 |
| D | 14 | 34 | 1101680 | 311.5 | 14431 | 13988 | 3491.8 |
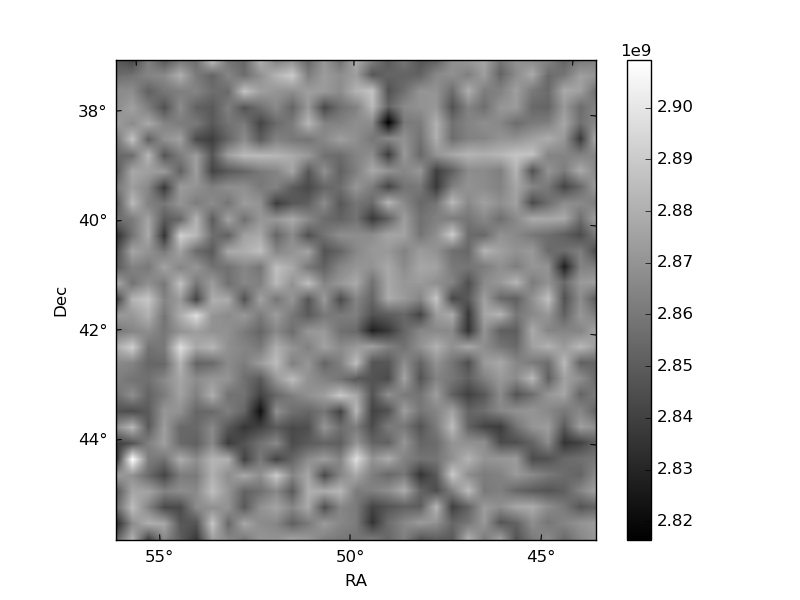
Histogram calculated using DETX and DETY for each event in the final _common_clean file
| Quadrant A |  |
 |
Quadrant B |
|---|---|---|---|
| Quadrant D | 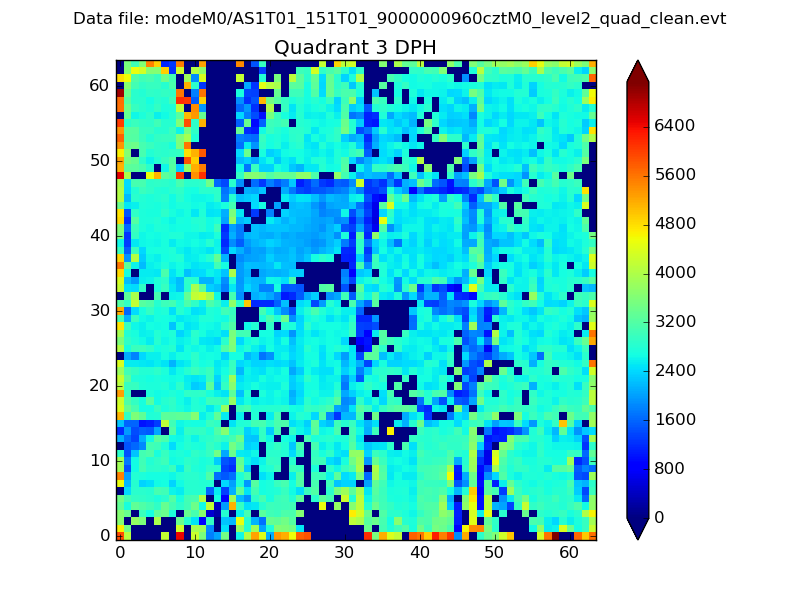 |
 |
Quadrant C |
| Plot type | Count rate plots | Images |
|---|---|---|
| Comparison with Poisson distribution Blue bars denote a histogram of data divided into 1 sec bins. Red curve is a Poisson curve with rate = median count rate of data. |
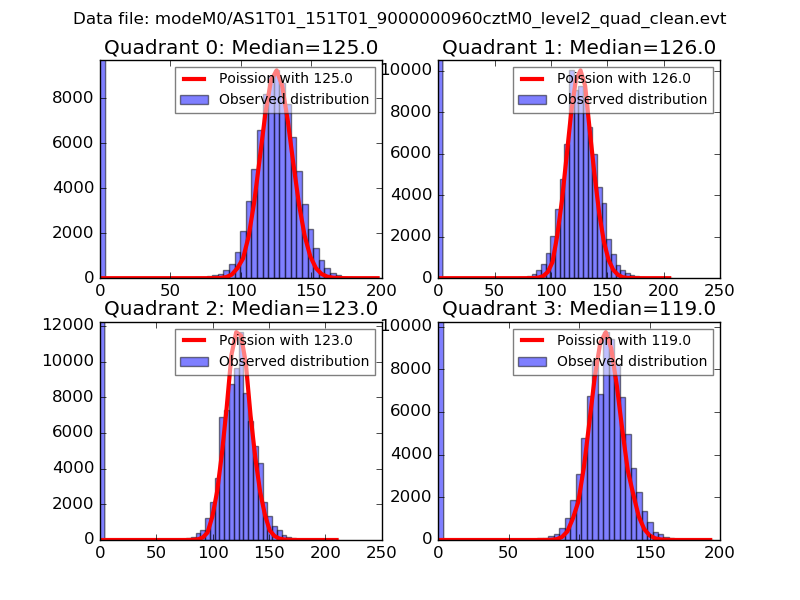 |
 |
| Quadrant-wise count rates Data is divided into 100 sec bins |
 |
|
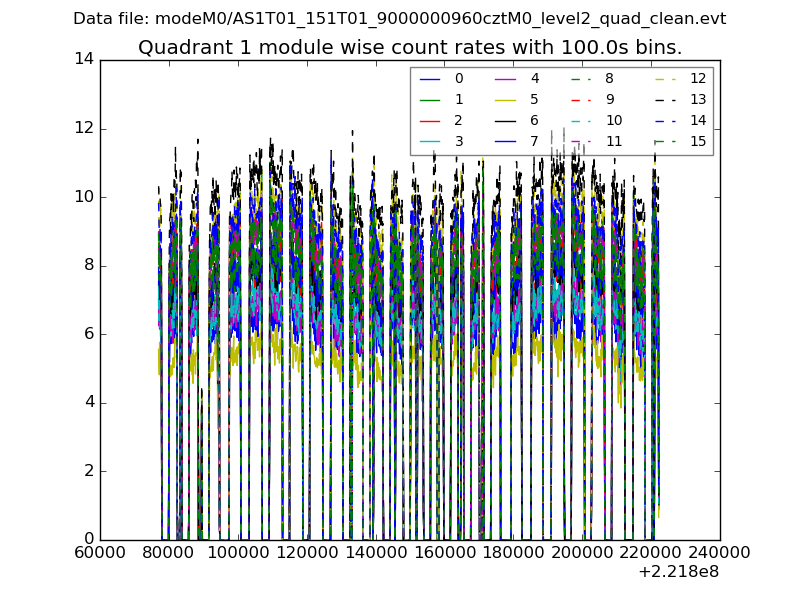
| Module-wise count rates for Quadrant A Data is divided into 100 sec bins |
 |
 |
| Module-wise count rates for Quadrant B Data is divided into 100 sec bins |
 |
 |
| Module-wise count rates for Quadrant C Data is divided into 100 sec bins |
 |
 |
| Module-wise count rates for Quadrant D Data is divided into 100 sec bins |
 |
 |
| Parameter | Plot |
|---|---|
| CZT HV Monitor |  |
| D_VDD | 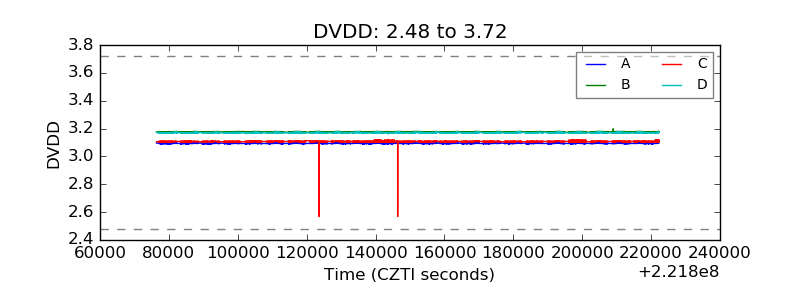 |
| Temperature 1 |  |
| Veto HV Monitor |  |
| Veto LLD |  |
| Alpha Counter | 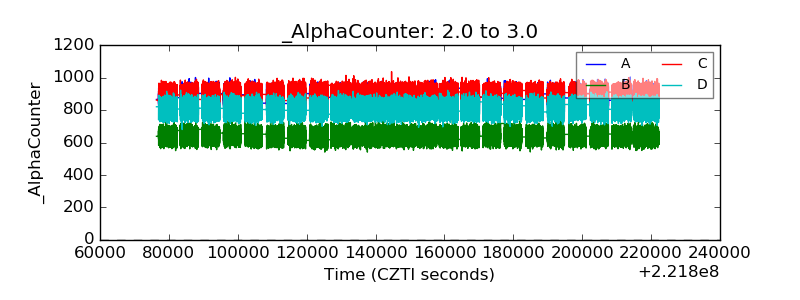 |
| _CPM_Rate | 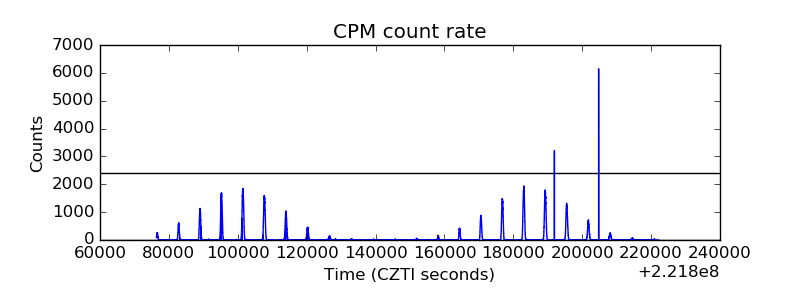 |
| CZT Counter |  |
| +2.5 Volts monitor |  |
| +5 Volts monitor |  |
| _ROLL_ROT |  |
| _Roll_DEC | 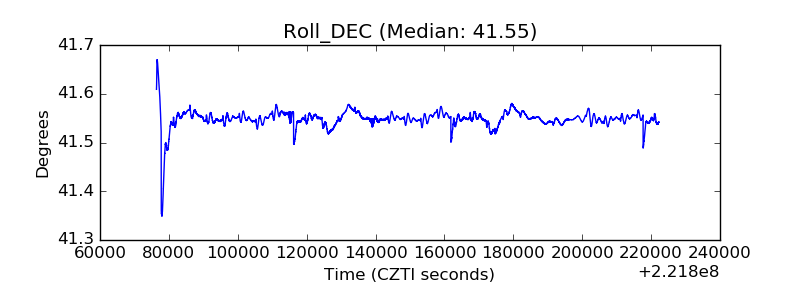 |
| _Roll_RA |  |
| Veto Counter | 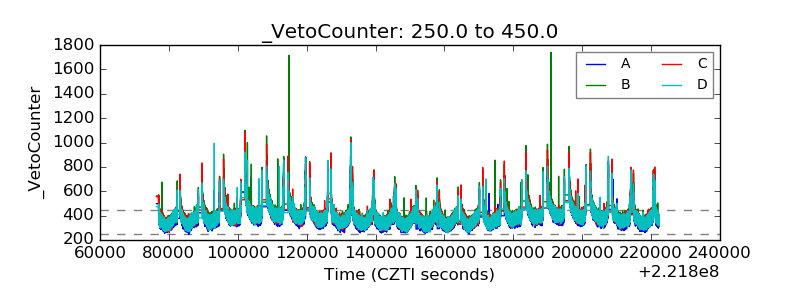 |