| Param | Original file | Final file |
|---|---|---|
| Filename | modeM0/AS1A02_090T02_9000000956cztM0_level2.evt | modeM0/AS1A02_090T02_9000000956cztM0_level2_quad_clean.evt |
| Size (bytes) | 9,387,072,000 | 1,630,068,480 |
| Size | 8.7 GB | 1.5 GB |
| Events in quadrant A | 65,114,443 | 10,010,672 |
| Events in quadrant B | 71,216,976 | 10,103,253 |
| Events in quadrant C | 63,555,076 | 10,077,842 |
| Events in quadrant D | 75,030,430 | 9,664,336 |
| Mode SS | |||
|---|---|---|---|
| Quadrant | BADHDUFLAG | Total packets | Discarded packets |
| A | 0 | 2836 | 0 |
| B | 0 | 2836 | 0 |
| C | 0 | 2836 | 0 |
| D | 0 | 2836 | 0 |
| Mode M0 | |||
|---|---|---|---|
| Quadrant | BADHDUFLAG | Total packets | Discarded packets |
| A | 0 | 286818 | 0 |
| B | 0 | 304397 | 0 |
| C | 0 | 284925 | 0 |
| D | 0 | 313032 | 0 |
| Mode M9 | |||
|---|---|---|---|
| Quadrant | BADHDUFLAG | Total packets | Discarded packets |
| A | 0 | 212 | 0 |
| B | 0 | 212 | 0 |
| C | 0 | 212 | 0 |
| D | 0 | 212 | 0 |
| Quadrant | Total seconds | Saturated seconds | Saturation percentage |
|---|---|---|---|
| A | 138892 | 1549 | 1.115255% |
| B | 138877 | 2663 | 1.917524% |
| C | 138895 | 1111 | 0.799885% |
| D | 138887 | 1912 | 1.376659% |
Noise dominated data is calculated using 1-second bins in cleaned event files. If a bin has >2000 counts, and if more than 50% of those come from <1% of pixels, then it is considered to be noise-dominated and hence unusable.
| Quadrant | # 1 sec bins | Bins with >0 counts | Bins with >2000 counts | High rate bins dominated by noise | Noise dominated (total time) | Noise dominated (detector-on time) | Marked lightcurve |
|---|---|---|---|---|---|---|---|
| A | 160522 | 138957 | 11 | 11 | 0.01% | 0.01% |  |
| B | 160522 | 138937 | 479 | 479 | 0.30% | 0.34% |  |
| C | 160522 | 138954 | 5 | 5 | 0.00% | 0.00% |  |
| D | 160522 | 138943 | 522 | 522 | 0.33% | 0.38% |  |
Top three noisy pixels from each quadrant. If the there are fewer than three noisy pixels in the level2.evt file, extra rows are filled as -1
| Pixel properties | Quadrant properties | ||||||
|---|---|---|---|---|---|---|---|
| Quadrant | DetID | PixID | Counts | Sigma | Mean | Median | Sigma |
| A | 13 | 14 | 422430 | 121.62 | 16618 | 16267 | 3339.7 |
| A | 0 | 23 | 181444 | 49.46 | 16618 | 16267 | 3339.7 |
| A | 0 | 226 | 171832 | 46.58 | 16618 | 16267 | 3339.7 |
| B | 0 | 228 | 4804087 | 1520.07 | 16638 | 16243 | 3149.7 |
| B | 4 | 81 | 319184 | 96.18 | 16638 | 16243 | 3149.7 |
| B | 12 | 111 | 315649 | 95.06 | 16638 | 16243 | 3149.7 |
| C | 7 | 247 | 175777 | 42.79 | 16176 | 16229 | 3728.3 |
| C | 13 | 61 | 127066 | 29.73 | 16176 | 16229 | 3728.3 |
| C | 12 | 4 | 109817 | 25.1 | 16176 | 16229 | 3728.3 |
| D | 8 | 195 | 8722455 | 2196.65 | 16188 | 15673 | 3963.7 |
| D | 2 | 136 | 1035030 | 257.18 | 16188 | 15673 | 3963.7 |
| D | 1 | 239 | 839164 | 207.76 | 16188 | 15673 | 3963.7 |
Histogram calculated using DETX and DETY for each event in the final _common_clean file
| Quadrant A |  |
 |
Quadrant B |
|---|---|---|---|
| Quadrant D |  |
 |
Quadrant C |
| Plot type | Count rate plots | Images |
|---|---|---|
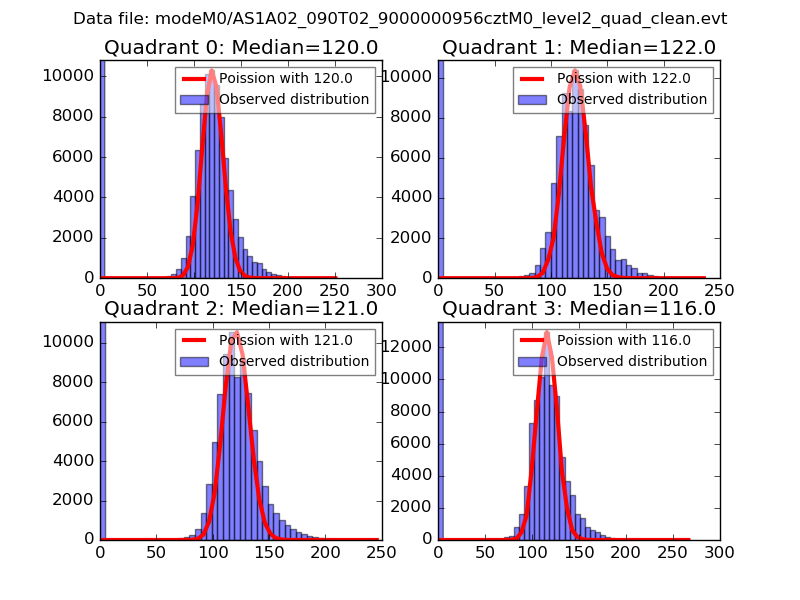
| Comparison with Poisson distribution Blue bars denote a histogram of data divided into 1 sec bins. Red curve is a Poisson curve with rate = median count rate of data. |
 |
 |
| Quadrant-wise count rates Data is divided into 100 sec bins |
 |
|
| Module-wise count rates for Quadrant A Data is divided into 100 sec bins |
 |
 |
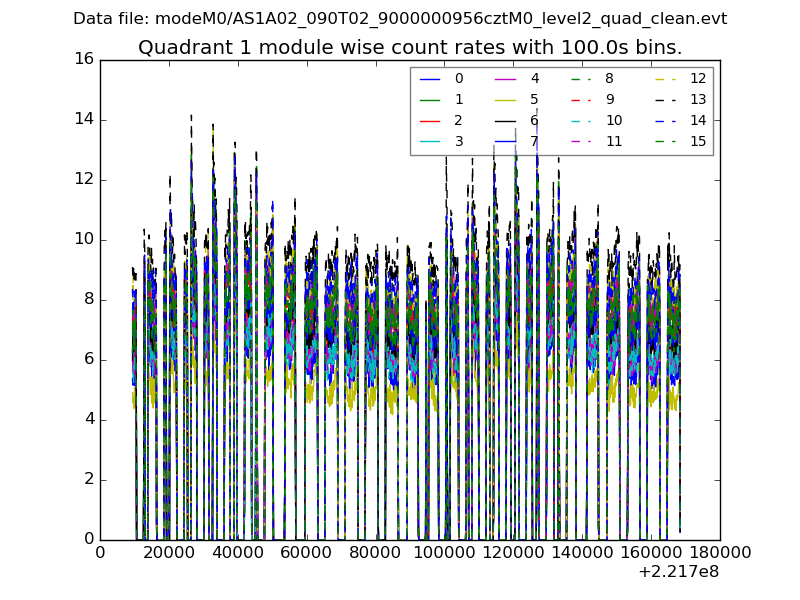
| Module-wise count rates for Quadrant B Data is divided into 100 sec bins |
 |
 |
| Module-wise count rates for Quadrant C Data is divided into 100 sec bins |
 |
 |
| Module-wise count rates for Quadrant D Data is divided into 100 sec bins |
 |
 |
| Parameter | Plot |
|---|---|
| CZT HV Monitor |  |
| D_VDD |  |
| Temperature 1 |  |
| Veto HV Monitor |  |
| Veto LLD |  |
| Alpha Counter |  |
| _CPM_Rate |  |
| CZT Counter |  |
| +2.5 Volts monitor |  |
| +5 Volts monitor |  |
| _ROLL_ROT |  |
| _Roll_DEC |  |
| _Roll_RA |  |
| Veto Counter |  |