| Param | Original file | Final file |
|---|---|---|
| Filename | modeM0/AS1A02_111T01_9000000954cztM0_level2.evt | modeM0/AS1A02_111T01_9000000954cztM0_level2_quad_clean.evt |
| Size (bytes) | 2,030,022,720 | 388,494,720 |
| Size | 1.9 GB | 370.5 MB |
| Events in quadrant A | 13,453,065 | 2,461,820 |
| Events in quadrant B | 15,807,006 | 2,463,221 |
| Events in quadrant C | 13,359,962 | 2,437,698 |
| Events in quadrant D | 16,814,484 | 2,324,277 |
| Mode M0 | |||
|---|---|---|---|
| Quadrant | BADHDUFLAG | Total packets | Discarded packets |
| A | 0 | 61696 | 0 |
| B | 0 | 67842 | 0 |
| C | 0 | 61656 | 0 |
| D | 0 | 70561 | 0 |
| Mode M9 | |||
|---|---|---|---|
| Quadrant | BADHDUFLAG | Total packets | Discarded packets |
| A | 0 | 21 | 0 |
| B | 0 | 21 | 0 |
| C | 0 | 21 | 0 |
| D | 0 | 21 | 0 |
| Mode SS | |||
|---|---|---|---|
| Quadrant | BADHDUFLAG | Total packets | Discarded packets |
| A | 0 | 616 | 0 |
| B | 0 | 616 | 0 |
| C | 0 | 616 | 0 |
| D | 0 | 616 | 0 |
| Quadrant | Total seconds | Saturated seconds | Saturation percentage |
|---|---|---|---|
| A | 30265 | 194 | 0.641004% |
| B | 30265 | 686 | 2.266645% |
| C | 30265 | 111 | 0.366760% |
| D | 30265 | 332 | 1.096977% |
Noise dominated data is calculated using 1-second bins in cleaned event files. If a bin has >2000 counts, and if more than 50% of those come from <1% of pixels, then it is considered to be noise-dominated and hence unusable.
| Quadrant | # 1 sec bins | Bins with >0 counts | Bins with >2000 counts | High rate bins dominated by noise | Noise dominated (total time) | Noise dominated (detector-on time) | Marked lightcurve |
|---|---|---|---|---|---|---|---|
| A | 32290 | 30271 | 0 | 0 | 0.00% | 0.00% |  |
| B | 32290 | 30271 | 244 | 244 | 0.76% | 0.81% |  |
| C | 32290 | 30271 | 4 | 4 | 0.01% | 0.01% | 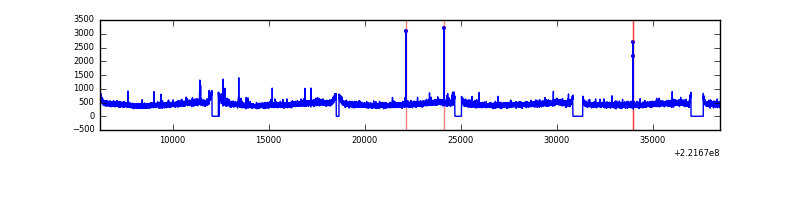 |
| D | 32290 | 30271 | 126 | 126 | 0.39% | 0.42% |  |
Top three noisy pixels from each quadrant. If the there are fewer than three noisy pixels in the level2.evt file, extra rows are filled as -1
| Pixel properties | Quadrant properties | ||||||
|---|---|---|---|---|---|---|---|
| Quadrant | DetID | PixID | Counts | Sigma | Mean | Median | Sigma |
| A | 0 | 226 | 33720 | 43.11 | 3477 | 3399 | 703.4 |
| A | 12 | 194 | 32168 | 40.9 | 3477 | 3399 | 703.4 |
| A | 13 | 248 | 30634 | 38.72 | 3477 | 3399 | 703.4 |
| B | 0 | 219 | 576691 | 876.22 | 3481 | 3393 | 654.3 |
| B | 0 | 228 | 562697 | 854.83 | 3481 | 3393 | 654.3 |
| B | 4 | 48 | 414285 | 628.0 | 3481 | 3393 | 654.3 |
| C | 7 | 247 | 53788 | 64.85 | 3388 | 3400 | 776.9 |
| C | 1 | 241 | 35683 | 41.55 | 3388 | 3400 | 776.9 |
| C | 12 | 4 | 30449 | 34.81 | 3388 | 3400 | 776.9 |
| D | 8 | 195 | 2104360 | 2560.5 | 3374 | 3272 | 820.6 |
| D | 14 | 34 | 439023 | 531.03 | 3374 | 3272 | 820.6 |
| D | 2 | 136 | 412834 | 499.11 | 3374 | 3272 | 820.6 |
Histogram calculated using DETX and DETY for each event in the final _common_clean file
| Quadrant A |  |
 |
Quadrant B |
|---|---|---|---|
| Quadrant D | 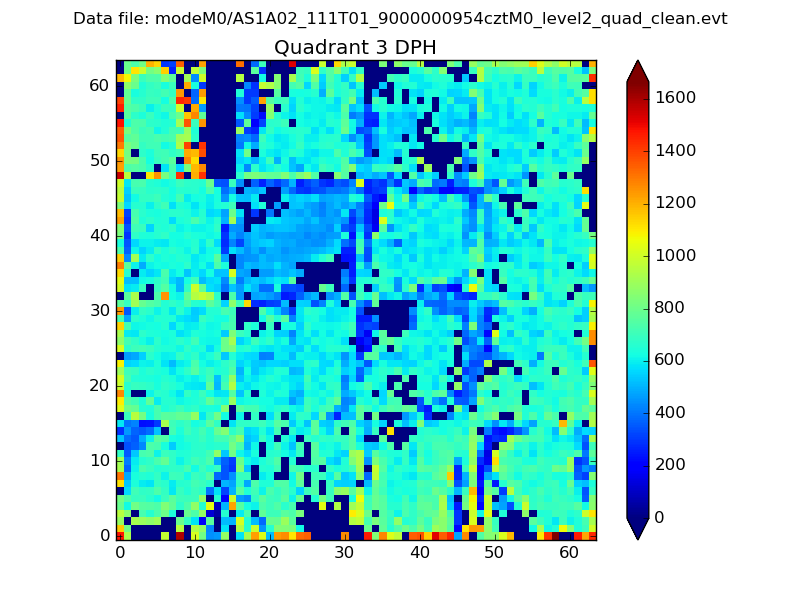 |
 |
Quadrant C |
| Plot type | Count rate plots | Images |
|---|---|---|
| Comparison with Poisson distribution Blue bars denote a histogram of data divided into 1 sec bins. Red curve is a Poisson curve with rate = median count rate of data. |
 |
 |
| Quadrant-wise count rates Data is divided into 100 sec bins |
 |
|
| Module-wise count rates for Quadrant A Data is divided into 100 sec bins |
 |
 |
| Module-wise count rates for Quadrant B Data is divided into 100 sec bins |
 |
 |
| Module-wise count rates for Quadrant C Data is divided into 100 sec bins |
 |
 |
| Module-wise count rates for Quadrant D Data is divided into 100 sec bins |
 |
 |
| Parameter | Plot |
|---|---|
| CZT HV Monitor |  |
| D_VDD |  |
| Temperature 1 |  |
| Veto HV Monitor |  |
| Veto LLD |  |
| Alpha Counter |  |
| _CPM_Rate |  |
| CZT Counter | 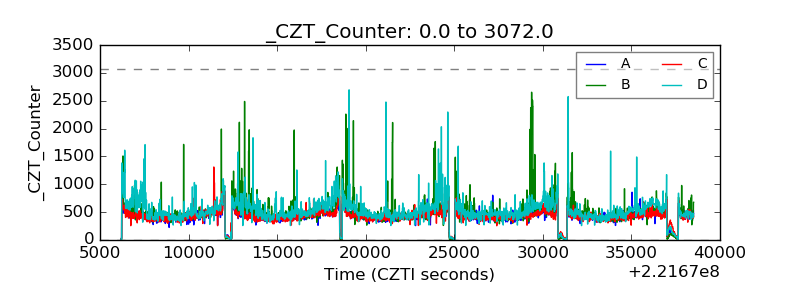 |
| +2.5 Volts monitor |  |
| +5 Volts monitor |  |
| _ROLL_ROT |  |
| _Roll_DEC |  |
| _Roll_RA |  |
| Veto Counter |  |