| Param | Original file | Final file |
|---|---|---|
| Filename | modeM0/AS1G06_164T01_9000000946cztM0_level2_bc.evt | modeM0/AS1G06_164T01_9000000946cztM0_level2_quad_clean.evt |
| Size (bytes) | 1,065,168,000 | 443,828,160 |
| Size | 1015.8 MB | 423.3 MB |
| Events in quadrant A | 6,758,988 | 2,834,334 |
| Events in quadrant B | 6,816,497 | 2,844,294 |
| Events in quadrant C | 6,965,469 | 2,766,223 |
| Events in quadrant D | 9,431,564 | 2,699,454 |
| Mode M0 | |||
|---|---|---|---|
| Quadrant | BADHDUFLAG | Total packets | Discarded packets |
| A | 0 | 69250 | 0 |
| B | 0 | 69455 | 0 |
| C | 0 | 69405 | 0 |
| D | 0 | 75813 | 0 |
| Mode M9 | |||
|---|---|---|---|
| Quadrant | BADHDUFLAG | Total packets | Discarded packets |
| A | 0 | 57 | 0 |
| B | 0 | 57 | 0 |
| C | 0 | 57 | 0 |
| D | 0 | 57 | 0 |
| Mode SS | |||
|---|---|---|---|
| Quadrant | BADHDUFLAG | Total packets | Discarded packets |
| A | 0 | 678 | 0 |
| B | 0 | 678 | 0 |
| C | 0 | 678 | 0 |
| D | 0 | 678 | 0 |
| Quadrant | Total seconds | Saturated seconds | Saturation percentage |
|---|---|---|---|
| A | 33471 | 499 | 1.490843% |
| B | 33471 | 510 | 1.523707% |
| C | 33468 | 383 | 1.144377% |
| D | 33472 | 527 | 1.574450% |
Noise dominated data is calculated using 1-second bins in cleaned event files. If a bin has >2000 counts, and if more than 50% of those come from <1% of pixels, then it is considered to be noise-dominated and hence unusable.
| Quadrant | # 1 sec bins | Bins with >0 counts | Bins with >2000 counts | High rate bins dominated by noise | Noise dominated (total time) | Noise dominated (detector-on time) | Marked lightcurve |
|---|---|---|---|---|---|---|---|
| A | 39033 | 33475 | 0 | 0 | 0.00% | 0.00% | 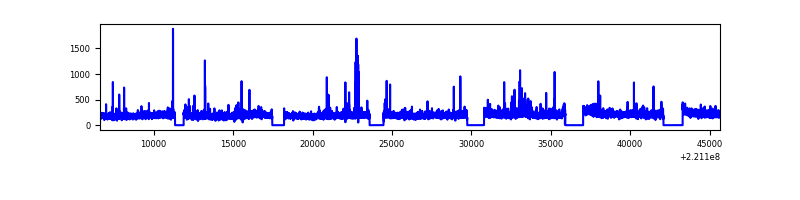 |
| B | 39033 | 33472 | 5 | 5 | 0.01% | 0.01% |  |
| C | 39033 | 33473 | 7 | 7 | 0.02% | 0.02% |  |
| D | 39033 | 33473 | 31 | 31 | 0.08% | 0.09% | 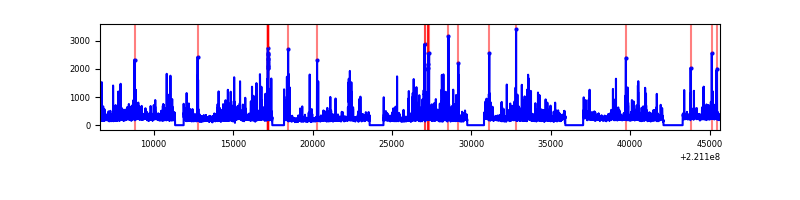 |
Top three noisy pixels from each quadrant. If the there are fewer than three noisy pixels in the level2.evt file, extra rows are filled as -1
| Pixel properties | Quadrant properties | ||||||
|---|---|---|---|---|---|---|---|
| Quadrant | DetID | PixID | Counts | Sigma | Mean | Median | Sigma |
| A | 13 | 251 | 132782 | 357.83 | 1672 | 1641 | 366.5 |
| A | 4 | 2 | 73904 | 197.17 | 1672 | 1641 | 366.5 |
| A | 13 | 248 | 60020 | 159.29 | 1672 | 1641 | 366.5 |
| B | 15 | 204 | 49898 | 147.9 | 1682 | 1633 | 326.3 |
| B | 4 | 48 | 45287 | 133.77 | 1682 | 1633 | 326.3 |
| B | 0 | 228 | 42074 | 123.92 | 1682 | 1633 | 326.3 |
| C | 9 | 247 | 358802 | 1001.43 | 1625 | 1598 | 356.7 |
| C | 9 | 68 | 98402 | 271.39 | 1625 | 1598 | 356.7 |
| C | 1 | 3 | 57316 | 156.21 | 1625 | 1598 | 356.7 |
| D | 8 | 195 | 1237850 | 3158.55 | 1648 | 1582 | 391.4 |
| D | 2 | 152 | 749235 | 1910.18 | 1648 | 1582 | 391.4 |
| D | 14 | 34 | 325066 | 826.47 | 1648 | 1582 | 391.4 |
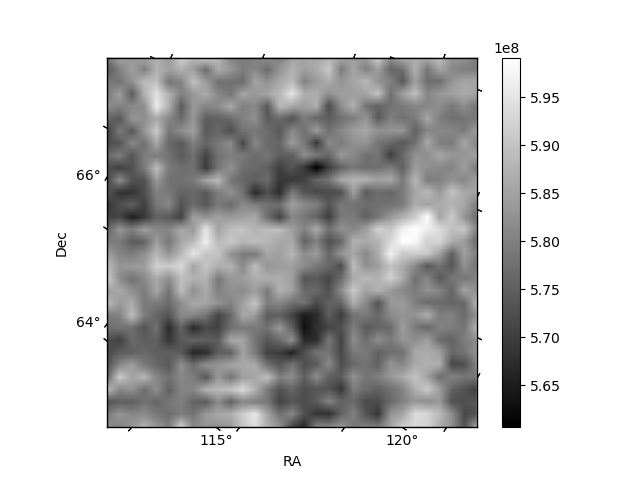
Histogram calculated using DETX and DETY for each event in the final _common_clean file
| Quadrant A |  |
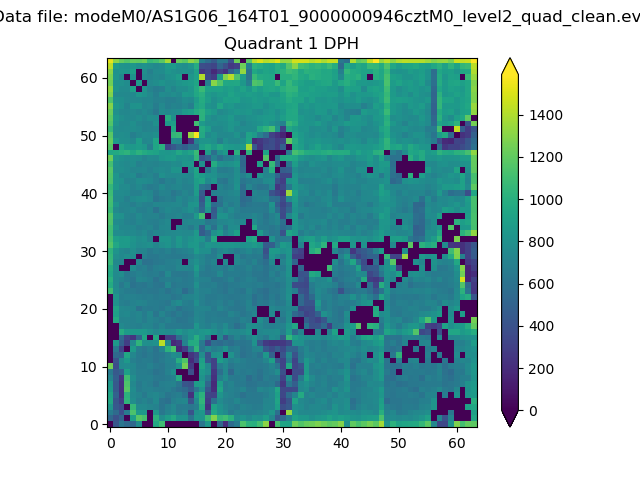 |
Quadrant B |
|---|---|---|---|
| Quadrant D |  |
 |
Quadrant C |
| Plot type | Count rate plots | Images |
|---|---|---|
| Comparison with Poisson distribution Blue bars denote a histogram of data divided into 1 sec bins. Red curve is a Poisson curve with rate = median count rate of data. |
 |
 |
| Quadrant-wise count rates Data is divided into 100 sec bins |
 |
|
| Module-wise count rates for Quadrant A Data is divided into 100 sec bins |
 |
 |
| Module-wise count rates for Quadrant B Data is divided into 100 sec bins |
 |
 |
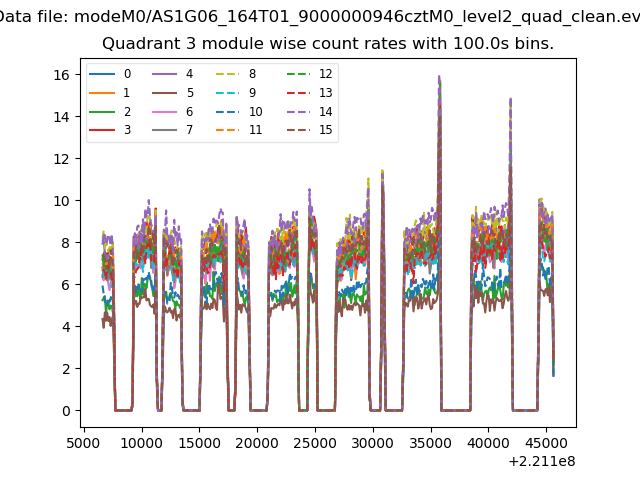
| Module-wise count rates for Quadrant C Data is divided into 100 sec bins |
 |
 |
| Module-wise count rates for Quadrant D Data is divided into 100 sec bins |
 |
 |
| Parameter | Plot |
|---|---|
| CZT HV Monitor |  |
| D_VDD |  |
| Temperature 1 |  |
| Veto HV Monitor | 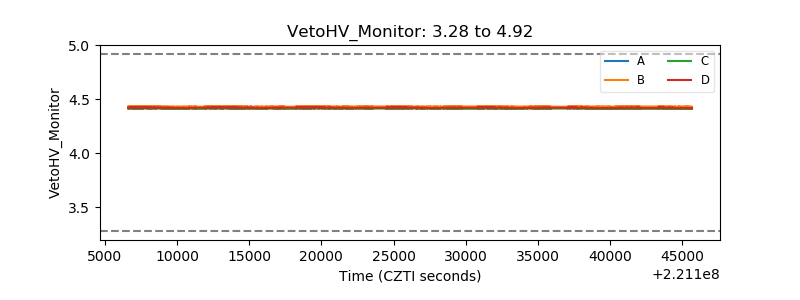 |
| Veto LLD |  |
| Alpha Counter |  |
| _CPM_Rate |  |
| CZT Counter |  |
| +2.5 Volts monitor | 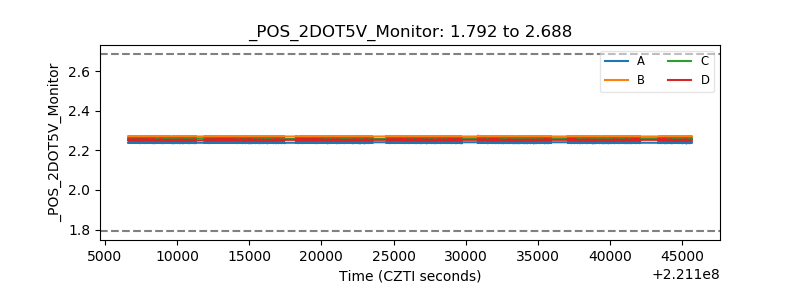 |
| +5 Volts monitor |  |
| _ROLL_ROT |  |
| _Roll_DEC | 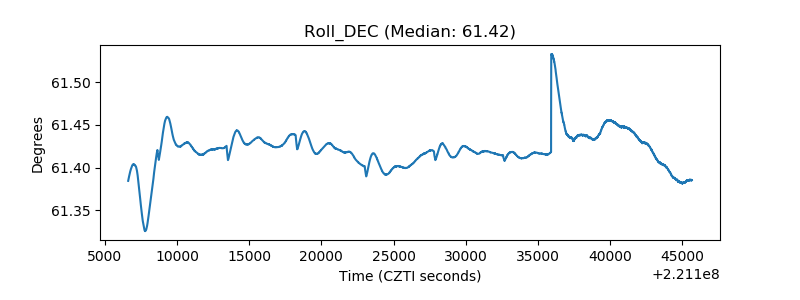 |
| _Roll_RA |  |
| Veto Counter |  |