| Param | Original file | Final file |
|---|---|---|
| Filename | modeM0/AS1A02_005T01_9000000948cztM0_level2.evt | modeM0/AS1A02_005T01_9000000948cztM0_level2_quad_clean.evt |
| Size (bytes) | 5,751,034,560 | 1,129,852,800 |
| Size | 5.4 GB | 1.1 GB |
| Events in quadrant A | 40,370,336 | 7,126,235 |
| Events in quadrant B | 42,136,909 | 7,209,758 |
| Events in quadrant C | 41,850,433 | 7,154,521 |
| Events in quadrant D | 44,048,074 | 6,877,169 |
| Mode M9 | |||
|---|---|---|---|
| Quadrant | BADHDUFLAG | Total packets | Discarded packets |
| A | 0 | 160 | 0 |
| B | 0 | 160 | 0 |
| C | 0 | 160 | 0 |
| D | 0 | 160 | 0 |
| Mode SS | |||
|---|---|---|---|
| Quadrant | BADHDUFLAG | Total packets | Discarded packets |
| A | 0 | 1748 | 0 |
| B | 0 | 1748 | 0 |
| C | 0 | 1748 | 0 |
| D | 0 | 1748 | 0 |
| Mode M0 | |||
|---|---|---|---|
| Quadrant | BADHDUFLAG | Total packets | Discarded packets |
| A | 0 | 178431 | 0 |
| B | 0 | 182739 | 0 |
| C | 0 | 179520 | 0 |
| D | 0 | 188507 | 0 |
| Quadrant | Total seconds | Saturated seconds | Saturation percentage |
|---|---|---|---|
| A | 85408 | 982 | 1.149775% |
| B | 85408 | 1189 | 1.392141% |
| C | 85408 | 1014 | 1.187242% |
| D | 85408 | 1216 | 1.423754% |
Noise dominated data is calculated using 1-second bins in cleaned event files. If a bin has >2000 counts, and if more than 50% of those come from <1% of pixels, then it is considered to be noise-dominated and hence unusable.
| Quadrant | # 1 sec bins | Bins with >0 counts | Bins with >2000 counts | High rate bins dominated by noise | Noise dominated (total time) | Noise dominated (detector-on time) | Marked lightcurve |
|---|---|---|---|---|---|---|---|
| A | 141242 | 85431 | 12 | 12 | 0.01% | 0.01% |  |
| B | 141242 | 85431 | 52 | 52 | 0.04% | 0.06% | 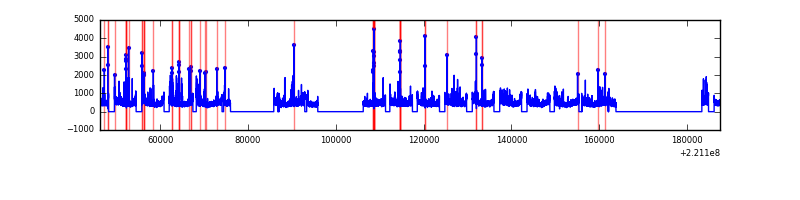 |
| C | 141242 | 85431 | 39 | 39 | 0.03% | 0.05% | 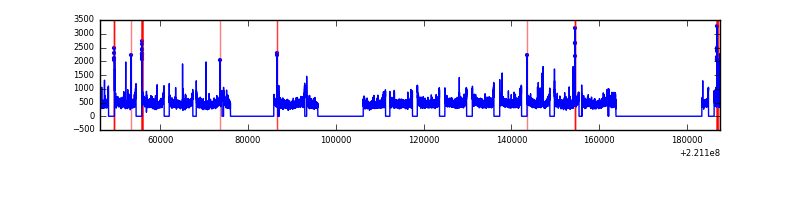 |
| D | 141242 | 85431 | 337 | 337 | 0.24% | 0.39% |  |
Top three noisy pixels from each quadrant. If the there are fewer than three noisy pixels in the level2.evt file, extra rows are filled as -1
| Pixel properties | Quadrant properties | ||||||
|---|---|---|---|---|---|---|---|
| Quadrant | DetID | PixID | Counts | Sigma | Mean | Median | Sigma |
| A | 15 | 223 | 209810 | 96.01 | 10326 | 10117 | 2079.9 |
| A | 13 | 251 | 157681 | 70.95 | 10326 | 10117 | 2079.9 |
| A | 0 | 226 | 103622 | 44.96 | 10326 | 10117 | 2079.9 |
| B | 4 | 48 | 466738 | 234.05 | 10398 | 10158 | 1950.8 |
| B | 0 | 214 | 328938 | 163.41 | 10398 | 10158 | 1950.8 |
| B | 0 | 219 | 302016 | 149.61 | 10398 | 10158 | 1950.8 |
| C | 9 | 247 | 2173506 | 937.01 | 10066 | 10116 | 2308.8 |
| C | 9 | 16 | 133416 | 53.4 | 10066 | 10116 | 2308.8 |
| C | 4 | 254 | 118749 | 47.05 | 10066 | 10116 | 2308.8 |
| D | 8 | 195 | 1382971 | 563.09 | 10071 | 9774 | 2438.7 |
| D | 13 | 169 | 1197114 | 486.88 | 10071 | 9774 | 2438.7 |
| D | 12 | 221 | 1122211 | 456.17 | 10071 | 9774 | 2438.7 |
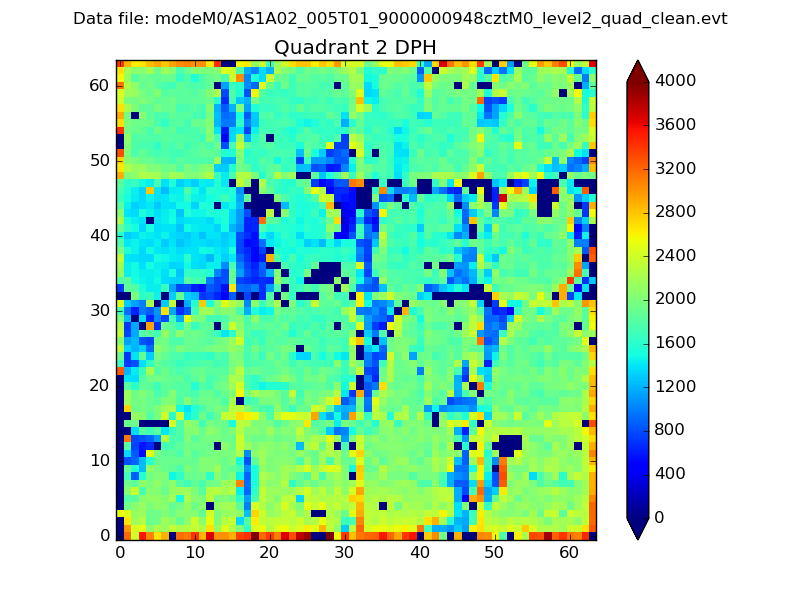
Histogram calculated using DETX and DETY for each event in the final _common_clean file
| Quadrant A |  |
 |
Quadrant B |
|---|---|---|---|
| Quadrant D |  |
 |
Quadrant C |
| Plot type | Count rate plots | Images |
|---|---|---|
| Comparison with Poisson distribution Blue bars denote a histogram of data divided into 1 sec bins. Red curve is a Poisson curve with rate = median count rate of data. |
 |
 |
| Quadrant-wise count rates Data is divided into 100 sec bins |
 |
|
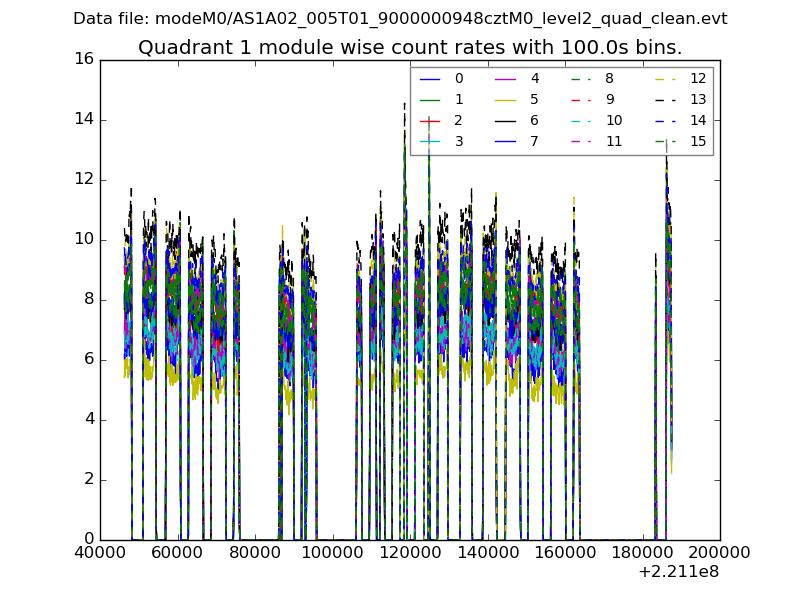
| Module-wise count rates for Quadrant A Data is divided into 100 sec bins |
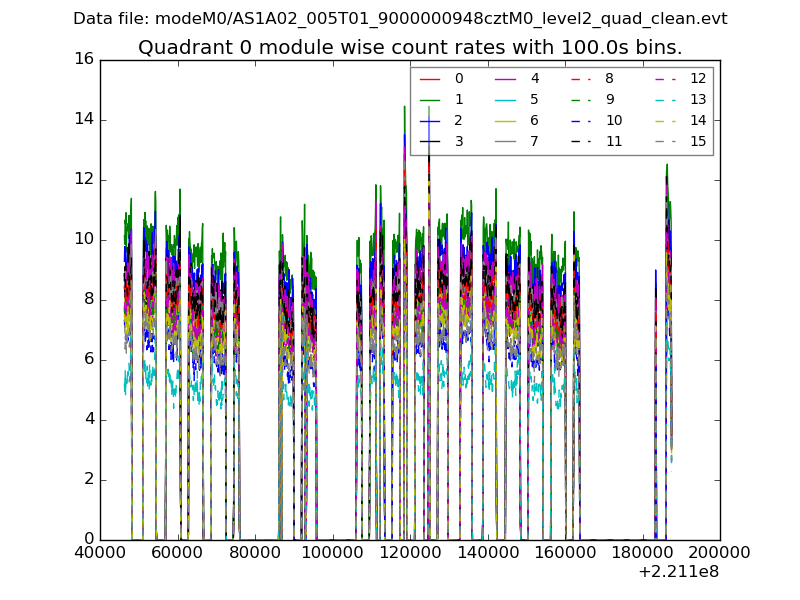 |
 |
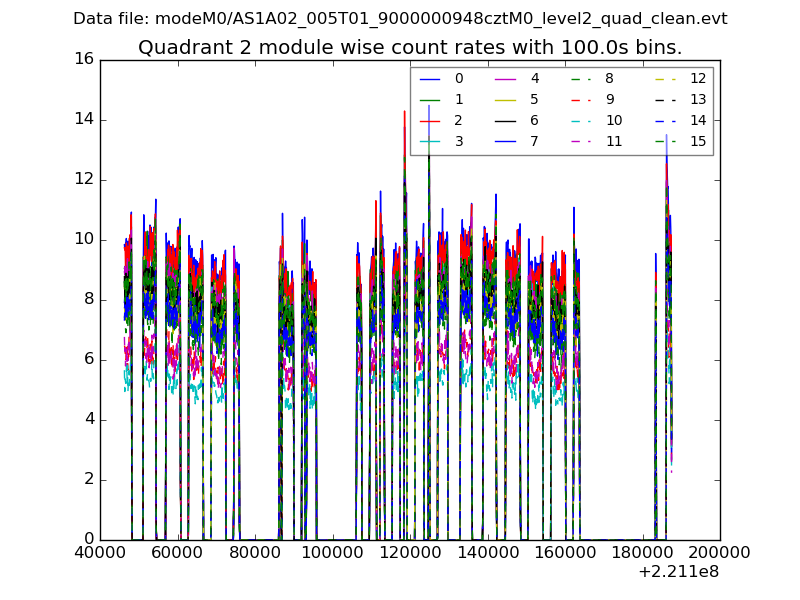
| Module-wise count rates for Quadrant B Data is divided into 100 sec bins |
 |
 |
| Module-wise count rates for Quadrant C Data is divided into 100 sec bins |
 |
 |
| Module-wise count rates for Quadrant D Data is divided into 100 sec bins |
 |
 |
| Parameter | Plot |
|---|---|
| CZT HV Monitor |  |
| D_VDD |  |
| Temperature 1 |  |
| Veto HV Monitor |  |
| Veto LLD |  |
| Alpha Counter |  |
| _CPM_Rate |  |
| CZT Counter | 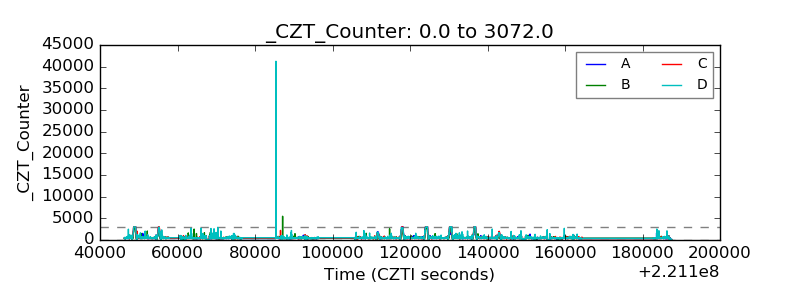 |
| +2.5 Volts monitor |  |
| +5 Volts monitor |  |
| _ROLL_ROT |  |
| _Roll_DEC |  |
| _Roll_RA | 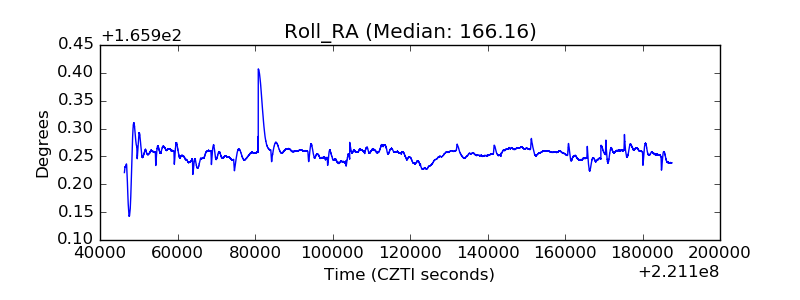 |
| Veto Counter |  |